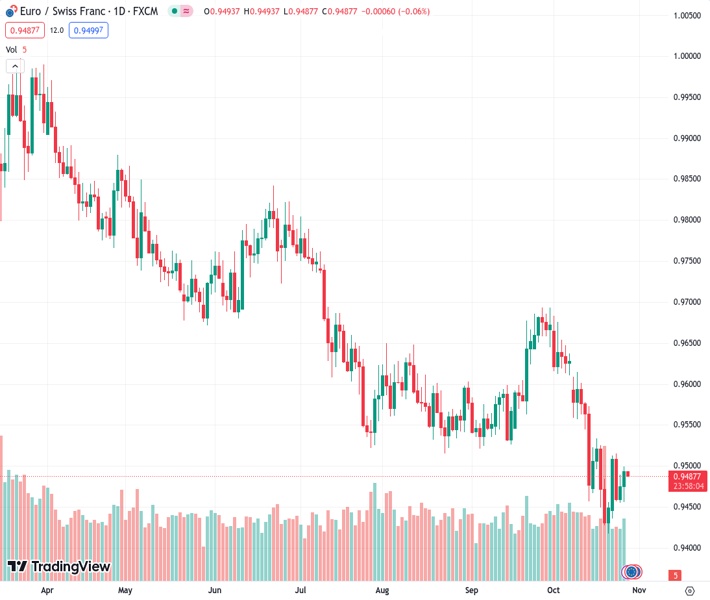
#EURCHF @ 0.94930 rebounds from a daily low of 0.9456 to trade at 0.9491, up 0.17%.
…
This is a premium post.
[s2If !current_user_can(access_s2member_level4)]Please register for FREE REGISTER to read full post below containing analysis. In case of any error or you think you are not able to read the full post below, please email us at support#nehcap.com [lwa][/s2If] [s2If current_user_can(access_s2member_level1)]
- EUR/CHF rebounds from a daily low of 0.9456 to trade at 0.9491, up 0.17%.
The pair currently trades last at 0.94930.
The previous day high was 0.9489 while the previous day low was 0.9456. The daily 38.2% Fib levels comes at 0.9477, expected to provide support. Similarly, the daily 61.8% fib level is at 0.9469, expected to provide support.
EUR/CHF jumped from daily lows of around 0.9456 after the European Central Bank (ECB) decided to hold rates, initially tumbling the pair. Nevertheless, the cross paired its losses late in the North American session and climbed 0.17%, trading at 0.9491.
The daily chat portrays the pair as downward biased, though the ongoing upward correction will face a solid resistance level at the October 17 swing high at 0.9533, which, if cleared, could pave the way for the cross to test the 50-day moving average (DMA) at 0.9585. A breach of the latter, and the psychological 0.9600 figure, would be up next.
On the other hand, and the path of least resistance, the EUR/CHF first support is seen at 0.9450. If the pair slips past that level, the next floor would be the October 20 low of 0.9417, ahead of the September 26, 2022 low of 0.9403.
Technical Levels: Supports and Resistances
EURCHF currently trading at 0.9495 at the time of writing. Pair opened at 0.9476 and is trading with a change of 0.2 % .
| Overview | Overview.1 | |
|---|---|---|
| 0 | Today last price | 0.9495 |
| 1 | Today Daily Change | 0.0019 |
| 2 | Today Daily Change % | 0.2000 |
| 3 | Today daily open | 0.9476 |
The pair remains strongly bearish on the daily time frame. It trades below the 20 SMA @ 0.9556, 50 SMA 0.9571, 100 SMA @ 0.9627 and 200 SMA @ 0.9744.
| Trends | Trends.1 | |
|---|---|---|
| 0 | Daily SMA20 | 0.9556 |
| 1 | Daily SMA50 | 0.9571 |
| 2 | Daily SMA100 | 0.9627 |
| 3 | Daily SMA200 | 0.9744 |
The previous day high was 0.9489 while the previous day low was 0.9456. The daily 38.2% Fib levels comes at 0.9477, expected to provide support. Similarly, the daily 61.8% fib level is at 0.9469, expected to provide support.
Note the levels of interest below:
- Pivot support is noted at 0.9458, 0.944, 0.9425
- Pivot resistance is noted at 0.9492, 0.9507, 0.9525
| Levels | Levels.1 |
|---|---|
| Previous Daily High | 0.9489 |
| Previous Daily Low | 0.9456 |
| Previous Weekly High | 0.9534 |
| Previous Weekly Low | 0.9418 |
| Previous Monthly High | 0.9694 |
| Previous Monthly Low | 0.9521 |
| Daily Fibonacci 38.2% | 0.9477 |
| Daily Fibonacci 61.8% | 0.9469 |
| Daily Pivot Point S1 | 0.9458 |
| Daily Pivot Point S2 | 0.9440 |
| Daily Pivot Point S3 | 0.9425 |
| Daily Pivot Point R1 | 0.9492 |
| Daily Pivot Point R2 | 0.9507 |
| Daily Pivot Point R3 | 0.9525 |
[/s2If]
Download Nehcap EAWe have two EAs that are operational on our LIVE accounts.
- EA-FIX: Check out the details here. Download EA-FIX . EA-FIX is a non-grid HFT scalper.
- EA-GROWTH: High quality low dd EA using trend grids. Download EA_GROWTHJoin Our Telegram Group


