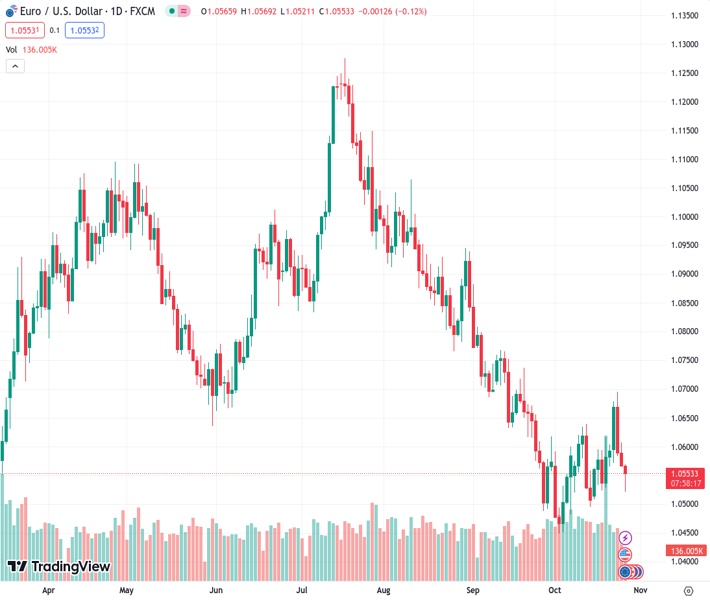
#EURUSD @ 1.05564 Price Analysis: Further downside remains in the pipeline
…
This is a premium post.
[s2If !current_user_can(access_s2member_level4)]Please register for FREE REGISTER to read full post below containing analysis. In case of any error or you think you are not able to read the full post below, please email us at support#nehcap.com [lwa][/s2If] [s2If current_user_can(access_s2member_level1)]
- The pair currently trades last at 1.05564.
- Pivot support is noted at 1.0553, 1.0539, 1.0512
- Pivot resistance is noted at 1.0594, 1.0621, 1.0635
- EA-FIX: Check out the details here. Download EA-FIX . EA-FIX is a non-grid HFT scalper.
- EA-GROWTH: High quality low dd EA using trend grids. Download EA_GROWTHJoin Our Telegram Group
The previous day high was 1.0607 while the previous day low was 1.0566. The daily 38.2% Fib levels comes at 1.0581, expected to provide resistance. Similarly, the daily 61.8% fib level is at 1.0591, expected to provide resistance.
– EUR/USD drops for the third session in a row and retests 1.0520.
– Extra decline could see the pair accelerate losses to the 1.0500 zone.
EUR/USD maintains the offered bias and printed new lows in the 1.0520 region on Thursday.
If bears push harder, then the pair could drop to the weekly low of 1.0495 (October 13) prior to the 2023 low of 1.0448 (October 3). The loss of the later could put a probable visit to the round level of 1.0400 back on the radar in the not-so-distant future.
In the meantime, while below the 200-day SMA at 1.0813, the pair’s outlook should remain negative.
Technical Levels: Supports and Resistances
EURUSD currently trading at 1.0547 at the time of writing. Pair opened at 1.0567 and is trading with a change of -0.19 % .
| Overview | Overview.1 | |
|---|---|---|
| 0 | Today last price | 1.0547 |
| 1 | Today Daily Change | 48.0000 |
| 2 | Today Daily Change % | -0.1900 |
| 3 | Today daily open | 1.0567 |
The pair remains strongly bearish on the daily time frame. It trades below the 20 SMA @ 1.0561, 50 SMA 1.0672, 100 SMA @ 1.0823 and 200 SMA @ 1.0816.
| Trends | Trends.1 | |
|---|---|---|
| 0 | Daily SMA20 | 1.0561 |
| 1 | Daily SMA50 | 1.0672 |
| 2 | Daily SMA100 | 1.0823 |
| 3 | Daily SMA200 | 1.0816 |
The previous day high was 1.0607 while the previous day low was 1.0566. The daily 38.2% Fib levels comes at 1.0581, expected to provide resistance. Similarly, the daily 61.8% fib level is at 1.0591, expected to provide resistance.
Note the levels of interest below:
| Levels | Levels.1 |
|---|---|
| Previous Daily High | 1.0607 |
| Previous Daily Low | 1.0566 |
| Previous Weekly High | 1.0617 |
| Previous Weekly Low | 1.0511 |
| Previous Monthly High | 1.0882 |
| Previous Monthly Low | 1.0488 |
| Daily Fibonacci 38.2% | 1.0581 |
| Daily Fibonacci 61.8% | 1.0591 |
| Daily Pivot Point S1 | 1.0553 |
| Daily Pivot Point S2 | 1.0539 |
| Daily Pivot Point S3 | 1.0512 |
| Daily Pivot Point R1 | 1.0594 |
| Daily Pivot Point R2 | 1.0621 |
| Daily Pivot Point R3 | 1.0635 |
[/s2If]
Download Nehcap EAWe have two EAs that are operational on our LIVE accounts.


