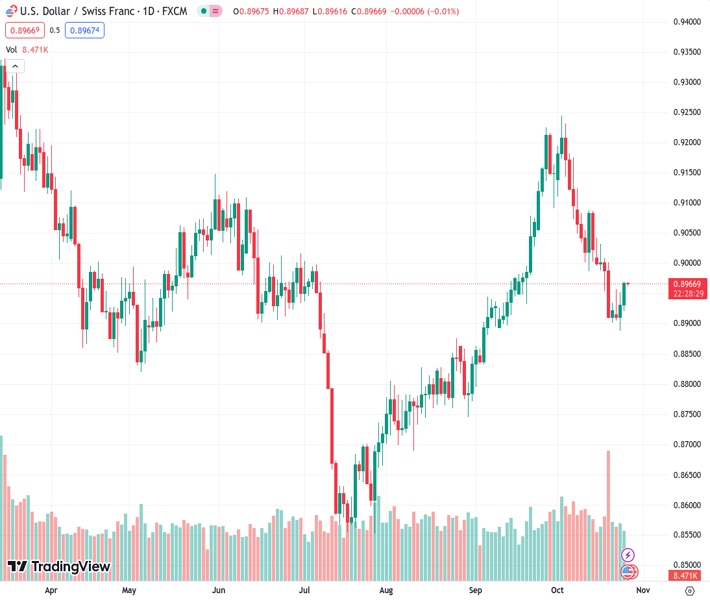
#USDCHF @ 0.89670 gained 0.41% in Wednesday’s session, as the pair has rallied on two of the last three trading days.
…
This is a premium post.
[s2If !current_user_can(access_s2member_level4)]Please register for FREE REGISTER to read full post below containing analysis. In case of any error or you think you are not able to read the full post below, please email us at support#nehcap.com [lwa][/s2If] [s2If current_user_can(access_s2member_level1)]
- USD/CHF gained 0.41% in Wednesday’s session, as the pair has rallied on two of the last three trading days.
The pair currently trades last at 0.89670.
The previous day high was 0.8954 while the previous day low was 0.8888. The daily 38.2% Fib levels comes at 0.8929, expected to provide support. Similarly, the daily 61.8% fib level is at 0.8913, expected to provide support.
The USD/CHF climbs towards the 50-day moving average (DMA), finishing Wednesday’s session with gains of 0.41%, though it failed to achieve a daily close above the 50-DMA, leaving the pair exposed to selling pressure. As the Asian session begins, the USD/CHF trades at 0.8966, down a minimal 0.01%.
The major has rallied on two of the last three trading days, registering weekly gains of 0.50%, though it buyers would like to regain control, they must clear key resistance levels above the current exchange rate. Firstly, the 50-DMA at 0.8972, and then the 200-DMA at 0.9007. A decisive break would expose the October 12 high at 0.9088, before the USD/CHF aims to 0.9100.
On the flip side, if USD/CHF sellers want to resume the impending downtrend, they must crack the latest cycle low at 0.8887. Once cleared, the pair could dive toward the key support level at 0.8745, the August 30 low, before heading toward the August 10 swing low of 0.8689.
Technical Levels: Supports and Resistances
USDCHF currently trading at 0.8966 at the time of writing. Pair opened at 0.8932 and is trading with a change of 0.38 % .
| Overview | Overview.1 | |
|---|---|---|
| 0 | Today last price | 0.8966 |
| 1 | Today Daily Change | 0.0034 |
| 2 | Today Daily Change % | 0.3800 |
| 3 | Today daily open | 0.8932 |
The pair is trading below its 20 Daily moving average @ 0.906, below its 50 Daily moving average @ 0.8966 , above its 100 Daily moving average @ 0.8898 and below its 200 Daily moving average @ 0.9011
| Trends | Trends.1 | |
|---|---|---|
| 0 | Daily SMA20 | 0.9060 |
| 1 | Daily SMA50 | 0.8966 |
| 2 | Daily SMA100 | 0.8898 |
| 3 | Daily SMA200 | 0.9011 |
The previous day high was 0.8954 while the previous day low was 0.8888. The daily 38.2% Fib levels comes at 0.8929, expected to provide support. Similarly, the daily 61.8% fib level is at 0.8913, expected to provide support.
Note the levels of interest below:
- Pivot support is noted at 0.8896, 0.8859, 0.883
- Pivot resistance is noted at 0.8961, 0.899, 0.9027
| Levels | Levels.1 |
|---|---|
| Previous Daily High | 0.8954 |
| Previous Daily Low | 0.8888 |
| Previous Weekly High | 0.9042 |
| Previous Weekly Low | 0.8902 |
| Previous Monthly High | 0.9225 |
| Previous Monthly Low | 0.8795 |
| Daily Fibonacci 38.2% | 0.8929 |
| Daily Fibonacci 61.8% | 0.8913 |
| Daily Pivot Point S1 | 0.8896 |
| Daily Pivot Point S2 | 0.8859 |
| Daily Pivot Point S3 | 0.8830 |
| Daily Pivot Point R1 | 0.8961 |
| Daily Pivot Point R2 | 0.8990 |
| Daily Pivot Point R3 | 0.9027 |
[/s2If]
Download Nehcap EAWe have two EAs that are operational on our LIVE accounts.
- EA-FIX: Check out the details here. Download EA-FIX . EA-FIX is a non-grid HFT scalper.
- EA-GROWTH: High quality low dd EA using trend grids. Download EA_GROWTHJoin Our Telegram Group


