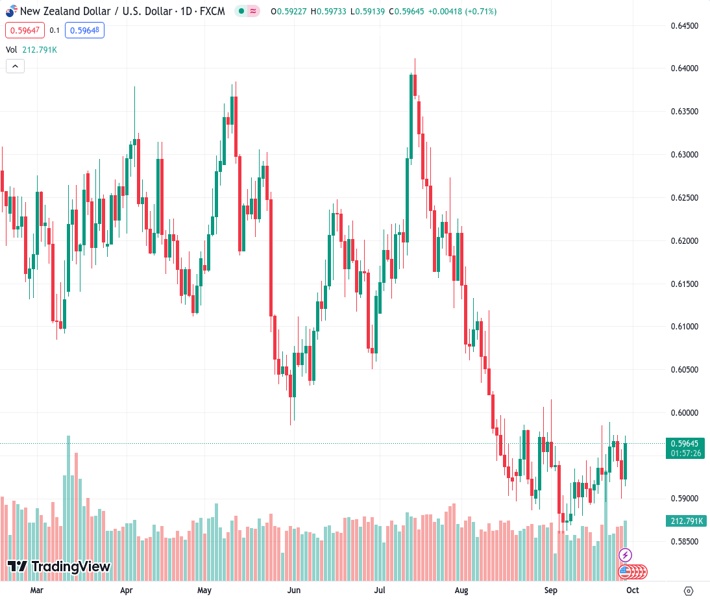
The New Zealand dollar is experiencing upward momentum, with a rise of almost 1% against the US dollar on Thursday.
…
This is a premium post.
[s2If !current_user_can(access_s2member_level4)]Please register for FREE REGISTER to read full post below containing analysis. In case of any error or you think you are not able to read the full post below, please email us at support#nehcap.com [lwa][/s2If] [s2If current_user_can(access_s2member_level1)]
- The Kiwi is facing upside momentum, climbing nearly a percent against the Greenback for Thursday.
The pair currently trades last at 0.59645.
The previous day high was 0.5958 while the previous day low was 0.5899. The daily 38.2% Fib levels comes at 0.5922, expected to provide support. Similarly, the daily 61.8% fib level is at 0.5935, expected to provide support.
The NZD/USD has ticked about five basis points higher through Thursday’s market trading, driven by a receding Greenback (USD). Ongoing economic concerns and spiking US Treasury yields has seen the USD bolstered across the broader market this week, but Thursday sees a step back in US Dollar action, giving the Kiwi (NZD) a brief reprieve and recovering some recent losses.
China’s ongoing property debacle continues to sap confidence in the Asia sector currencies. Evergrande, the world’s single most indebted property developer, had its chairman Hui Ka Yan placed under police watch this week as funding and liquidity concerns grip China’s real estate sector. China’s real estate and property development segment has reached such an outsized proportion of China’s domestic economy that increased instability in construction could threaten the rest of the economy.
There is little of note on the economic calendar for the Kiwi, and market participants will be looking ahead to the US Personal Consumption Expenditure (PCE) Price Index figures due on Friday at 12:30 GMT.
The US PCE inflation reading is forecast to hold steady for the month of August at the previous print of 0.2%, with the annualized figure for the same period seen tipping back from 4.2% to 3.9%.
A beat on the Federal Reserve’s (Fed) favorite inflation indicator could see the USD spike further on the charts, as higher-than-expected inflation will be increasingly likely to push the Fed into holding higher interest rates for even longer than anticipated.
The Kiwi is currently capped under the 0.5970 handle after reaching an intraday high of 0.5975. The NZD/USD has broken to the north side of a minor descending trendline on hourly candles, and near-term support is baked in at the 200-hour Simple Moving Average (SMA) near 0.5940.
On daily candlesticks, the NZD/USD is pinned to the 34-day Exponential Moving Average, and the pair is pricing in a floor from the 0.5900 major handle. Long-term moving averages are rolling over bearish, and the 200-day SMA is settling to the low side of 0.6200.
Bidders will first have to crack the 34-day EMA and the 0.600 major psychological level before moving higher, while a resurgence of downside pressure will see the pair set to take a new run at ten-month lows below 0.5845.
Technical Levels: Supports and Resistances
NZDUSD currently trading at 0.5965 at the time of writing. Pair opened at 0.5923 and is trading with a change of 0.71 % .
| Overview | Overview.1 | |
|---|---|---|
| 0 | Today last price | 0.5965 |
| 1 | Today Daily Change | 0.0042 |
| 2 | Today Daily Change % | 0.7100 |
| 3 | Today daily open | 0.5923 |
The pair is trading above its 20 Daily moving average @ 0.5921, below its 50 Daily moving average @ 0.5997 , below its 100 Daily moving average @ 0.6085 and below its 200 Daily moving average @ 0.6182
| Trends | Trends.1 | |
|---|---|---|
| 0 | Daily SMA20 | 0.5921 |
| 1 | Daily SMA50 | 0.5997 |
| 2 | Daily SMA100 | 0.6085 |
| 3 | Daily SMA200 | 0.6182 |
The previous day high was 0.5958 while the previous day low was 0.5899. The daily 38.2% Fib levels comes at 0.5922, expected to provide support. Similarly, the daily 61.8% fib level is at 0.5935, expected to provide support.
Note the levels of interest below:
- Pivot support is noted at 0.5895, 0.5868, 0.5836
- Pivot resistance is noted at 0.5954, 0.5986, 0.6013
| Levels | Levels.1 |
|---|---|
| Previous Daily High | 0.5958 |
| Previous Daily Low | 0.5899 |
| Previous Weekly High | 0.5990 |
| Previous Weekly Low | 0.5894 |
| Previous Monthly High | 0.6219 |
| Previous Monthly Low | 0.5885 |
| Daily Fibonacci 38.2% | 0.5922 |
| Daily Fibonacci 61.8% | 0.5935 |
| Daily Pivot Point S1 | 0.5895 |
| Daily Pivot Point S2 | 0.5868 |
| Daily Pivot Point S3 | 0.5836 |
| Daily Pivot Point R1 | 0.5954 |
| Daily Pivot Point R2 | 0.5986 |
| Daily Pivot Point R3 | 0.6013 |
[/s2If]
Download Nehcap EAWe have two EAs that are operational on our LIVE accounts.
- EA-FIX: Check out the details here. Download EA-FIX . EA-FIX is a non-grid HFT scalper.
- EA-GROWTH: High quality low dd EA using trend grids. Download EA_GROWTHJoin Our Telegram Group


