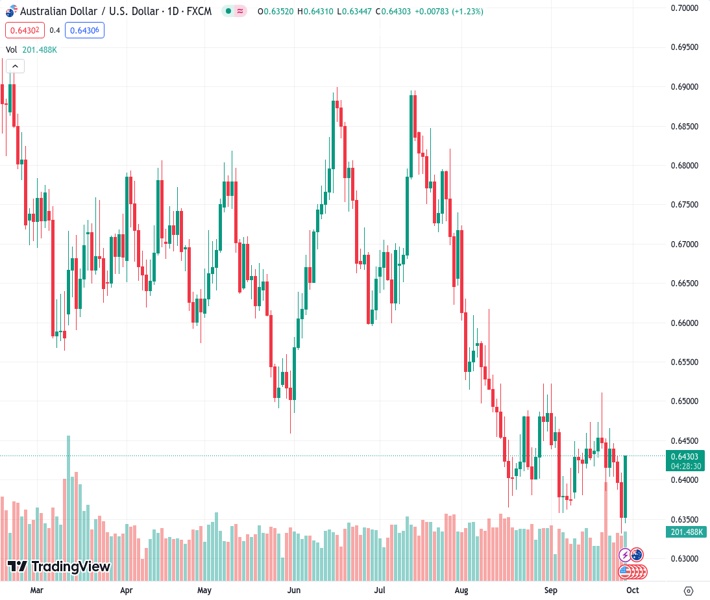
The Australian Dollar to US Dollar exchange rate, currently at 0.64301, has experienced a recovery after reaching low levels. This upward movement can be attributed to the decline of the US Dollar.
…
This is a premium post.
[s2If !current_user_can(access_s2member_level4)]Please register for FREE REGISTER to read full post below containing analysis. In case of any error or you think you are not able to read the full post below, please email us at support#nehcap.com [lwa][/s2If] [s2If current_user_can(access_s2member_level1)]
- The AUD/USD has rebounded from recent lows, pushed higher by a retreating US Dollar.
The pair currently trades last at 0.64301.
The previous day high was 0.6409 while the previous day low was 0.6332. The daily 38.2% Fib levels comes at 0.6361, expected to provide support. Similarly, the daily 61.8% fib level is at 0.638, expected to provide support.
The AUD/USD has caught a much-needed bounce from near-term lows around 0.6340, and the pair is up over 1% after reclaiming the 0.6400 handle in Thursday trading. The Aussie-Dollar pairing is currently taking a breather and marking in territory near 0.6420.
Australian Retail Sales came in below expectations early Thursday, printing at a seasonally-adjusted 0.2% for the month of August. The previous reading saw 0.5%, and the actual headline figure failed to meet market forecasts of 0.3%.
US data came in mixed on Thursday, with Gross Domestic Product (GDP) hitting the middle at expectations.
US GDP for the second quarter printed as-expected at 2.1% over the previous quarter; Initial Jobless Claims improved slightly, from 202K to 204K.
The downside came from US Pending Home Sales for August, which clocked in an abysmal -7.1%, far below the forecast -0.8% and a complete reversal from the previous print of 0.9%.
All that’s left on the economic calendar data docket for the US Dollar is Friday’s Personal Consumption Expenditure (PCE) Price Index. August’s PCE is forecast to hold steady at 0.2%.
The Aussie broke loose from recent intraday bearish action, jumping up a full percentage point to ping against the 200-hour Simple Moving Average near 0.6420.
Near-term technical resistance sits at the last swing high last week near 0.6460, and bidders will be looking to catch support from the 100-hour SMA currently drifting into the 0.6400 handle.
The overall trend still remains firmly bearish, and the AUD/USD remains well off recent highs on the daily candlesticks. Price action will see resistance from the 34-day Exponential Moving Average (EMA) just north of 0.6450, while downside momentum will see a support zone baked in at recent swing lows between 0.6400 and 0.6350.
Technical Levels: Supports and Resistances
AUDUSD currently trading at 0.6421 at the time of writing. Pair opened at 0.6353 and is trading with a change of 1.07 % .
| Overview | Overview.1 | |
|---|---|---|
| 0 | Today last price | 0.6421 |
| 1 | Today Daily Change | 0.0068 |
| 2 | Today Daily Change % | 1.0700 |
| 3 | Today daily open | 0.6353 |
The pair remains strongly bearish on the daily time frame. It trades below the 20 SMA @ 0.6422, 50 SMA 0.6499, 100 SMA @ 0.6593 and 200 SMA @ 0.6692.
| Trends | Trends.1 | |
|---|---|---|
| 0 | Daily SMA20 | 0.6422 |
| 1 | Daily SMA50 | 0.6499 |
| 2 | Daily SMA100 | 0.6593 |
| 3 | Daily SMA200 | 0.6692 |
The previous day high was 0.6409 while the previous day low was 0.6332. The daily 38.2% Fib levels comes at 0.6361, expected to provide support. Similarly, the daily 61.8% fib level is at 0.638, expected to provide support.
Note the levels of interest below:
- Pivot support is noted at 0.632, 0.6287, 0.6242
- Pivot resistance is noted at 0.6398, 0.6442, 0.6475
| Levels | Levels.1 |
|---|---|
| Previous Daily High | 0.6409 |
| Previous Daily Low | 0.6332 |
| Previous Weekly High | 0.6511 |
| Previous Weekly Low | 0.6385 |
| Previous Monthly High | 0.6724 |
| Previous Monthly Low | 0.6364 |
| Daily Fibonacci 38.2% | 0.6361 |
| Daily Fibonacci 61.8% | 0.6380 |
| Daily Pivot Point S1 | 0.6320 |
| Daily Pivot Point S2 | 0.6287 |
| Daily Pivot Point S3 | 0.6242 |
| Daily Pivot Point R1 | 0.6398 |
| Daily Pivot Point R2 | 0.6442 |
| Daily Pivot Point R3 | 0.6475 |
[/s2If]
Download Nehcap EAWe have two EAs that are operational on our LIVE accounts.
- EA-FIX: Check out the details here. Download EA-FIX . EA-FIX is a non-grid HFT scalper.
- EA-GROWTH: High quality low dd EA using trend grids. Download EA_GROWTHJoin Our Telegram Group


