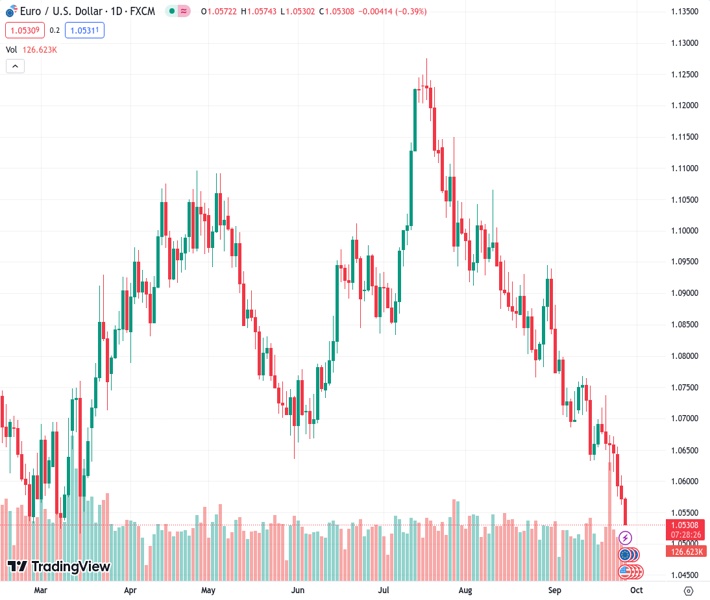
The EURUSD pair, currently at 1.05315, has declined further to reach new lows that haven’t been seen in several months, trading at approximately 1.0530.
…
This is a premium post.
[s2If !current_user_can(access_s2member_level4)]Please register for FREE REGISTER to read full post below containing analysis. In case of any error or you think you are not able to read the full post below, please email us at support#nehcap.com [lwa][/s2If] [s2If current_user_can(access_s2member_level1)]
- EUR/USD weakens to new multi-month lows around 1.0530.
The pair currently trades last at 1.05315.
The previous day high was 1.0609 while the previous day low was 1.0562. The daily 38.2% Fib levels comes at 1.058, expected to provide resistance. Similarly, the daily 61.8% fib level is at 1.0591, expected to provide resistance.
EUR/USD keeps the selling pressure well in place for the 7th session in a row on Wednesday, printing new six-month lows around 1.0530 .
The continuation of the downward bias should leave the pair vulnerable to further losses with the immediate target at the March low of 1.0516 (Mar 8), which is the last defence ahead of an assault on the 2023 low at 1.0481 (January 6).
While below the key 200-day SMA at 1.0827, the pair is likely to face extra weakness.
Technical Levels: Supports and Resistances
EURUSD currently trading at 1.0546 at the time of writing. Pair opened at 1.0573 and is trading with a change of -0.26 % .
| Overview | Overview.1 | |
|---|---|---|
| 0 | Today last price | 1.0546 |
| 1 | Today Daily Change | 40.0000 |
| 2 | Today Daily Change % | -0.2600 |
| 3 | Today daily open | 1.0573 |
The pair remains strongly bearish on the daily time frame. It trades below the 20 SMA @ 1.0711, 50 SMA 1.0859, 100 SMA @ 1.0869 and 200 SMA @ 1.083.
| Trends | Trends.1 | |
|---|---|---|
| 0 | Daily SMA20 | 1.0711 |
| 1 | Daily SMA50 | 1.0859 |
| 2 | Daily SMA100 | 1.0869 |
| 3 | Daily SMA200 | 1.0830 |
The previous day high was 1.0609 while the previous day low was 1.0562. The daily 38.2% Fib levels comes at 1.058, expected to provide resistance. Similarly, the daily 61.8% fib level is at 1.0591, expected to provide resistance.
Note the levels of interest below:
- Pivot support is noted at 1.0554, 1.0534, 1.0507
- Pivot resistance is noted at 1.0601, 1.0628, 1.0648
| Levels | Levels.1 |
|---|---|
| Previous Daily High | 1.0609 |
| Previous Daily Low | 1.0562 |
| Previous Weekly High | 1.0737 |
| Previous Weekly Low | 1.0615 |
| Previous Monthly High | 1.1065 |
| Previous Monthly Low | 1.0766 |
| Daily Fibonacci 38.2% | 1.0580 |
| Daily Fibonacci 61.8% | 1.0591 |
| Daily Pivot Point S1 | 1.0554 |
| Daily Pivot Point S2 | 1.0534 |
| Daily Pivot Point S3 | 1.0507 |
| Daily Pivot Point R1 | 1.0601 |
| Daily Pivot Point R2 | 1.0628 |
| Daily Pivot Point R3 | 1.0648 |
[/s2If]
Download Nehcap EAWe have two EAs that are operational on our LIVE accounts.
- EA-FIX: Check out the details here. Download EA-FIX . EA-FIX is a non-grid HFT scalper.
- EA-GROWTH: High quality low dd EA using trend grids. Download EA_GROWTHJoin Our Telegram Group


