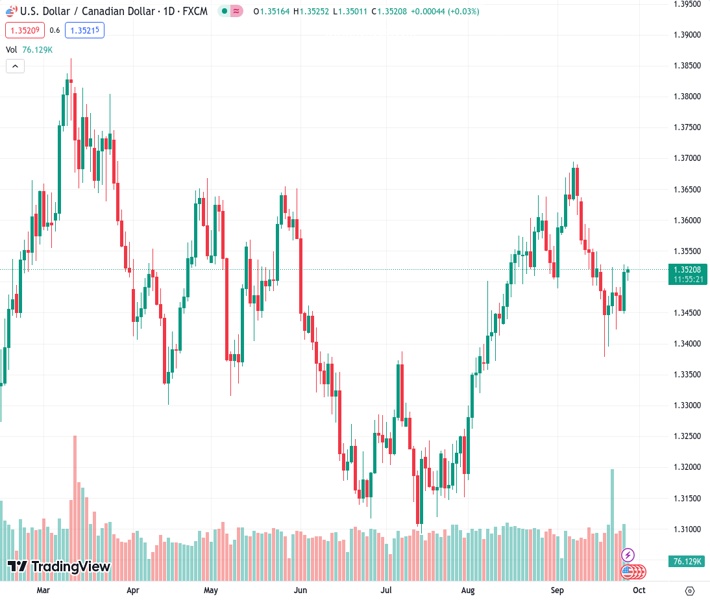
The USDCAD pair, currently at 1.35213, is making efforts to sustain its upward movement above the 1.3510 level.
…
This is a premium post.
[s2If !current_user_can(access_s2member_level4)]Please register for FREE REGISTER to read full post below containing analysis. In case of any error or you think you are not able to read the full post below, please email us at support#nehcap.com [lwa][/s2If] [s2If current_user_can(access_s2member_level1)]
- USD/CAD attempts to continue the gains above 1.3510.
The pair currently trades last at 1.35213.
The previous day high was 1.3528 while the previous day low was 1.3449. The daily 38.2% Fib levels comes at 1.3498, expected to provide support. Similarly, the daily 61.8% fib level is at 1.3479, expected to provide support.
USD/CAD struggles to extend gains on the second consecutive day, hovering above 1.3510 during the European session on Wednesday. The pair experiences upward support due to the risk aversion and improved US Treasury yields.
However, moderate economic data from the United States (US) could bolster the prevailing strength in the US Dollar (USD).
US Consumer Confidence released on Tuesday for September decreased to 103.0 from the reading of 108.7 in August. While Building Permits improved to 1.541M in August from 1.443M prior, falling short of the market expectation of 1.543M.
Moreover, the House Price Index month-month for July climbed to 0.8% compared to the market expectations of 0.5% from the previous rate of 0.4%.
Additionally, the Federal Reserve (Fed) is expected to raise policy rates through the end of the year as the US economy demonstrates resilience. This, in turn, boosts the US Treasury yields, which reinforces the strength of the US Dollar (USD).
The US Dollar Index (DXY) hovers around 106.30 by the press time, the highest level since December. The yield on the 10-year US Treasury note hovers below the highest level since October 2007, trading around 4.51% at the time of writing.
Furthermore, traders await the US Durable Goods Orders report to be released on Wednesday. Core Personal Consumption Expenditure (PCE) Price Index, the Fed’s preferred measure of consumer inflation, is due on Friday. The annual rate is anticipated to reduce from 4.2% to 3.9%.
On the flip side, the USD/CAD currency pair could be influenced by the price movements of the US Dollar due to the absence of Canada’s macros during the week. Canadian Gross Domestic Product (GDP) will be eyed on Friday.
However, the recent improvement in West Texas Intermediate (WTI) oil prices could potentially limit the upside of the USD/CAD pair. This improvement in oil prices is supportive of the Canadian Dollar (CAD) because Canada is a significant oil exporter to the United States.
WTI price extends its gains on the second day, trading higher above $90.70 per barrel by the press time.
As a result, the CAD is often referred to as a commodity-linked currency, and rising oil prices tend to strengthen it. This dynamic may counterbalance the impact of USD price movements on the USD/CAD pair.
Technical Levels: Supports and Resistances
USDCAD currently trading at 1.3516 at the time of writing. Pair opened at 1.3517 and is trading with a change of -0.01 % .
| Overview | Overview.1 | |
|---|---|---|
| 0 | Today last price | 1.3516 |
| 1 | Today Daily Change | -0.0001 |
| 2 | Today Daily Change % | -0.0100 |
| 3 | Today daily open | 1.3517 |
The pair is trading below its 20 Daily moving average @ 1.3543, above its 50 Daily moving average @ 1.3453 , above its 100 Daily moving average @ 1.3402 and above its 200 Daily moving average @ 1.346
| Trends | Trends.1 | |
|---|---|---|
| 0 | Daily SMA20 | 1.3543 |
| 1 | Daily SMA50 | 1.3453 |
| 2 | Daily SMA100 | 1.3402 |
| 3 | Daily SMA200 | 1.3460 |
The previous day high was 1.3528 while the previous day low was 1.3449. The daily 38.2% Fib levels comes at 1.3498, expected to provide support. Similarly, the daily 61.8% fib level is at 1.3479, expected to provide support.
Note the levels of interest below:
- Pivot support is noted at 1.3468, 1.3419, 1.3389
- Pivot resistance is noted at 1.3547, 1.3577, 1.3626
| Levels | Levels.1 |
|---|---|
| Previous Daily High | 1.3528 |
| Previous Daily Low | 1.3449 |
| Previous Weekly High | 1.3528 |
| Previous Weekly Low | 1.3379 |
| Previous Monthly High | 1.3640 |
| Previous Monthly Low | 1.3184 |
| Daily Fibonacci 38.2% | 1.3498 |
| Daily Fibonacci 61.8% | 1.3479 |
| Daily Pivot Point S1 | 1.3468 |
| Daily Pivot Point S2 | 1.3419 |
| Daily Pivot Point S3 | 1.3389 |
| Daily Pivot Point R1 | 1.3547 |
| Daily Pivot Point R2 | 1.3577 |
| Daily Pivot Point R3 | 1.3626 |
[/s2If]
Download Nehcap EAWe have two EAs that are operational on our LIVE accounts.
- EA-FIX: Check out the details here. Download EA-FIX . EA-FIX is a non-grid HFT scalper.
- EA-GROWTH: High quality low dd EA using trend grids. Download EA_GROWTHJoin Our Telegram Group


