NZDUSD is making an effort to increase its value as a result of the weakening of the US Dollar.
…
This is a premium post.
[s2If !current_user_can(access_s2member_level4)]Please register for FREE REGISTER to read full post below containing analysis. In case of any error or you think you are not able to read the full post below, please email us at support#nehcap.com [lwa][/s2If] [s2If current_user_can(access_s2member_level1)]
- NZD/USD attempts to extend gains due to soft US Dollar (USD).
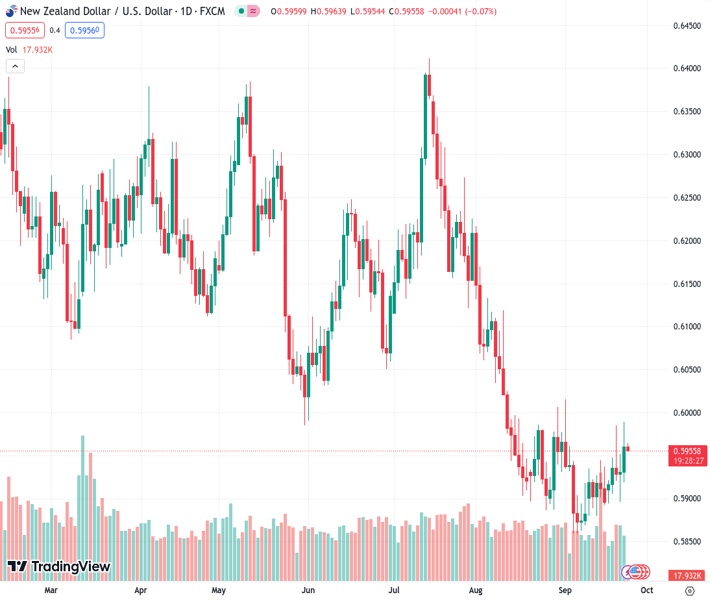
The pair currently trades last at 0.59576.
The previous day high was 0.599 while the previous day low was 0.5919. The daily 38.2% Fib levels comes at 0.5963, expected to provide resistance. Similarly, the daily 61.8% fib level is at 0.5946, expected to provide support.
NZD/USD looks to continue the two-day winning streak from the previous week, trading around 0.5960 during the early trading hours of the Asian session on Monday. However, the pair received upward support as the US Dollar (USD) retraced a portion of its intraday gains, which could be attributed to the fall in the US Treasury yields on Friday.
However, US bond yields snapped the recent losses, with the yield on US 10-year bond appreciating at 4.45%, up by 0.32% by the press time.
The New Zealand economy appears to be more resilient than initially anticipated, and the domestic data for September strongly emphasizes the necessity for further monetary policy tightening. Hence, the markets seem to price in the Official Cash Rate (OCR) hike by the Reserve Bank of New Zealand (RBNZ) through the end of the year 2023.
The economic data revealed on Friday that the Trade Balance NZD for August improved the annual trade deficit to $15.54B from the previous figures of $1588B. While Westpac Consumer Survey (Q3) report showed a decline regarding the economic outlook, with the index falling to 80.2 from 83.1 prior.
On the other side, the data from S&P Global has revealed that business activity in the United States (US) remained nearly unchanged in September. The S&P Global Manufacturing PMI improved to 48.9 from 47.9 the previous month, surpassing expectations of 48.0 figures.
Meanwhile, the Services PMI declined to 50.2 from 50.5 in July, which was expected to grow at a reading of 50.6. The Composite reading, which provides an overall view of business activity, was in line with estimates at 50.1 but lagged behind August’s 50.2 level.
US Dollar Index (DXY), which measures the value of the Greenback against other major currencies, struggles to gain momentum. The spot price beats around 105.50 at the time of writing.
Moreover, Boston Fed President Susan Collins stated that further tightening is possible but also emphasized the need for patience. Additionally, the Governor on the Federal Reserve’s board, Michelle W. Bowman echoed similar sentiments, asserting that more rate hikes are necessary to control inflation.
The Federal Reserve (Fed) has emphasized the importance of maintaining higher interest rates for an extended period to bring inflation back to its 2% target. This stance has increased market expectations for at least one more 25-basis-point rate hike by the end of the year.
Additionally, the Fed’s “dot plot” now indicates only two rate hikes in 2024, down from the previous projection of four rate hikes.
In the upcoming week, the economic calendar in the US will include key data releases such as Consumer Confidence, Durable Goods Orders, Initial Jobless Claims, and the Core PCE, which is the Fed’s preferred measure of inflation. On the Kiwi docket, economic indicators will feature Business and Consumer Confidence data. Market participants will closely monitor these releases for insights into the economic conditions in both countries.
Technical Levels: Supports and Resistances
NZDUSD currently trading at 0.5959 at the time of writing. Pair opened at 0.596 and is trading with a change of -0.02 % .
| Overview | Overview.1 | |
|---|---|---|
| 0 | Today last price | 0.5959 |
| 1 | Today Daily Change | -0.0001 |
| 2 | Today Daily Change % | -0.0200 |
| 3 | Today daily open | 0.5960 |
The pair is trading above its 20 Daily moving average @ 0.5922, below its 50 Daily moving average @ 0.6018 , below its 100 Daily moving average @ 0.6097 and below its 200 Daily moving average @ 0.6188
| Trends | Trends.1 | |
|---|---|---|
| 0 | Daily SMA20 | 0.5922 |
| 1 | Daily SMA50 | 0.6018 |
| 2 | Daily SMA100 | 0.6097 |
| 3 | Daily SMA200 | 0.6188 |
The previous day high was 0.599 while the previous day low was 0.5919. The daily 38.2% Fib levels comes at 0.5963, expected to provide resistance. Similarly, the daily 61.8% fib level is at 0.5946, expected to provide support.
Note the levels of interest below:
- Pivot support is noted at 0.5923, 0.5885, 0.5852
- Pivot resistance is noted at 0.5994, 0.6027, 0.6065
| Levels | Levels.1 |
|---|---|
| Previous Daily High | 0.5990 |
| Previous Daily Low | 0.5919 |
| Previous Weekly High | 0.5990 |
| Previous Weekly Low | 0.5894 |
| Previous Monthly High | 0.6219 |
| Previous Monthly Low | 0.5885 |
| Daily Fibonacci 38.2% | 0.5963 |
| Daily Fibonacci 61.8% | 0.5946 |
| Daily Pivot Point S1 | 0.5923 |
| Daily Pivot Point S2 | 0.5885 |
| Daily Pivot Point S3 | 0.5852 |
| Daily Pivot Point R1 | 0.5994 |
| Daily Pivot Point R2 | 0.6027 |
| Daily Pivot Point R3 | 0.6065 |
[/s2If]
Download Nehcap EAWe have two EAs that are operational on our LIVE accounts.
- EA-FIX: Check out the details here. Download EA-FIX . EA-FIX is a non-grid HFT scalper.
- EA-GROWTH: High quality low dd EA using trend grids. Download EA_GROWTHJoin Our Telegram Group


