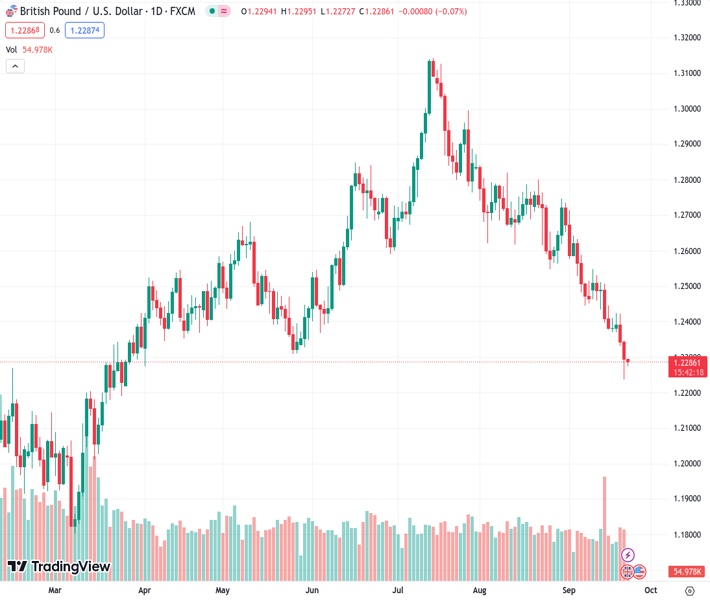
The GBPUSD is currently trading at 1.22858 and is still close to reaching a multi-month low that was established on Thursday.
…
This is a premium post.
[s2If !current_user_can(access_s2member_level4)]Please register for FREE REGISTER to read full post below containing analysis. In case of any error or you think you are not able to read the full post below, please email us at support#nehcap.com [lwa][/s2If] [s2If current_user_can(access_s2member_level1)]
- GBP/USD remains well within the striking distance of a multi-month low set on Thursday.
The pair currently trades last at 1.22858.
The previous day high was 1.2352 while the previous day low was 1.2235. The daily 38.2% Fib levels comes at 1.228, expected to provide support. Similarly, the daily 61.8% fib level is at 1.2307, expected to provide resistance.
The GBP/USD pair struggles to capitalize on the previous day’s modest recovery from the 1.2235 area, or its lowest level since late March and meets with a fresh supply during the Asian session on Friday. Spot prices currently trade near the 1.2280-1.2275 region, down for the third successive day, and seem vulnerable to decline further.
The British Pound (GBP) continues with its relative underperformance in the wake of the Bank of England’s (BoE) surprise decision to leave interest rates unchanged on Thursday. In contrast, the Federal Reserve’s (Fed) hawkish outlook, signalling the possibility of at least one more rate hike by the end of this year, assists the US Dollar (USD) to hold steady just below a six-month peak. This, along with a generally softer tone around the equity markets, is seen benefitting the safe-haven Greenback and exerting downward pressure on the GBP/USD pair.
From a technical perspective, the recent steep downfall from the 1.1275 area, or a 17-month high touched in July, has been along a downward-sloping channel. This points to a well-established short-term downtrend and favours bearish traders. Furthermore, oscillators on the daily chart are holding deep in the negative territory and are still far from being in the oversold zone, validating the bearish outlook for the GBP/USD pair. Hence, a slide towards retesting the channel support, around the 1.2235-1.2230 region, looks like a distinct possibility.
Some follow-through selling will confirm a fresh bearish breakdown and drag spot prices further below the 1.2200 round figure, towards the next relevant support near the 1.2170-1.2165 zone. The GBP/USD pair could extend the downfall further towards the 1.2140-1.2135 intermediate support before eventually dropping to the 1.2100 mark.
On the flip side, any recovery above the 1.2300 round figure might now confront a stiff barrier near the overnight swing high, around the 1.2350 region. This is followed by resistance near the 1.2375 zone, which if cleared should allow the GBP/USD pair to reclaim the 1.2400 mark. Any subsequent move up, however, might still be seen as a selling opportunity and remain capped near the 200-day Simple Moving Average (SMA) support breakpoint, now turnd hurdle, near the 1.2435-1.2440 region.
Technical Levels: Supports and Resistances
GBPUSD currently trading at 1.2284 at the time of writing. Pair opened at 1.2298 and is trading with a change of -0.11 % .
| Overview | Overview.1 | |
|---|---|---|
| 0 | Today last price | 1.2284 |
| 1 | Today Daily Change | -0.0014 |
| 2 | Today Daily Change % | -0.1100 |
| 3 | Today daily open | 1.2298 |
The pair remains strongly bearish on the daily time frame. It trades below the 20 SMA @ 1.2507, 50 SMA 1.2683, 100 SMA @ 1.2647 and 200 SMA @ 1.2434.
| Trends | Trends.1 | |
|---|---|---|
| 0 | Daily SMA20 | 1.2507 |
| 1 | Daily SMA50 | 1.2683 |
| 2 | Daily SMA100 | 1.2647 |
| 3 | Daily SMA200 | 1.2434 |
The previous day high was 1.2352 while the previous day low was 1.2235. The daily 38.2% Fib levels comes at 1.228, expected to provide support. Similarly, the daily 61.8% fib level is at 1.2307, expected to provide resistance.
Note the levels of interest below:
- Pivot support is noted at 1.2238, 1.2179, 1.2122
- Pivot resistance is noted at 1.2355, 1.2411, 1.2471
| Levels | Levels.1 |
|---|---|
| Previous Daily High | 1.2352 |
| Previous Daily Low | 1.2235 |
| Previous Weekly High | 1.2548 |
| Previous Weekly Low | 1.2379 |
| Previous Monthly High | 1.2841 |
| Previous Monthly Low | 1.2548 |
| Daily Fibonacci 38.2% | 1.2280 |
| Daily Fibonacci 61.8% | 1.2307 |
| Daily Pivot Point S1 | 1.2238 |
| Daily Pivot Point S2 | 1.2179 |
| Daily Pivot Point S3 | 1.2122 |
| Daily Pivot Point R1 | 1.2355 |
| Daily Pivot Point R2 | 1.2411 |
| Daily Pivot Point R3 | 1.2471 |
[/s2If]
Download Nehcap EAWe have two EAs that are operational on our LIVE accounts.
- EA-FIX: Check out the details here. Download EA-FIX . EA-FIX is a non-grid HFT scalper.
- EA-GROWTH: High quality low dd EA using trend grids. Download EA_GROWTHJoin Our Telegram Group


