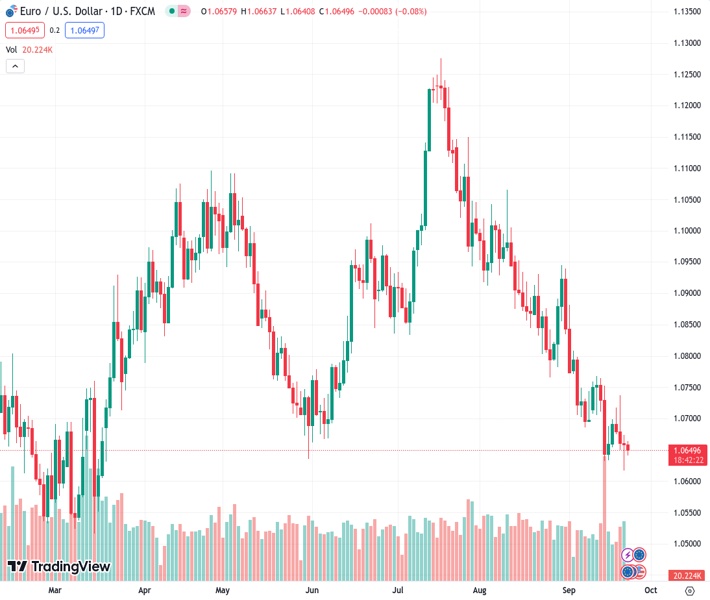
The EURUSD pair is facing downward pressure as the US Dollar (USD) has strengthened.
…
This is a premium post.
[s2If !current_user_can(access_s2member_level4)]Please register for FREE REGISTER to read full post below containing analysis. In case of any error or you think you are not able to read the full post below, please email us at support#nehcap.com [lwa][/s2If] [s2If current_user_can(access_s2member_level1)]
- EUR/USD experiences downward pressure due to improved US Dollar (USD).
The pair currently trades last at 1.06484.
The previous day high was 1.0674 while the previous day low was 1.0617. The daily 38.2% Fib levels comes at 1.0639, expected to provide support. Similarly, the daily 61.8% fib level is at 1.0652, expected to provide resistance.
EUR/USD continues the downward trajectory, trading lower around 1.0640 during the Asian session on Friday. The improved US Dollar (USD) exerts downward pressure on the pair, which could be attributed to the upbeat US Treasury yields.
The pair could meet a key support around the six-month low at 1.0616 aligned to the 1.0600 psychological level.
On the upside, the EUR/USD pair could face a challenge around the 1.0700 psychological level, followed by the 21-day Exponential Moving Average (EMA) at 1.0735.
A firm break above the latter could support the Euro buyers to explore the region around the 1.0750 psychological level lined up with the 23.6% Fibonacci retracement at the 1.0772 level.
The Moving Average Convergence Divergence (MACD) line remains below the centerline and aligns closely with the signal line. This setup indicates a state of equilibrium, implying that the momentum in the underlying asset’s price is relatively neutral, without a clear bias towards either bullish or bearish sentiment.
However, the momentum observed in the EUR/USD pair suggests a prevailing bearish sentiment in the market, given that the 14-day Relative Strength Index (RSI) continues to stay below the 50 level.
Technical Levels: Supports and Resistances
EURUSD currently trading at 1.0641 at the time of writing. Pair opened at 1.066 and is trading with a change of -0.18 % .
| Overview | Overview.1 | |
|---|---|---|
| 0 | Today last price | 1.0641 |
| 1 | Today Daily Change | -0.0019 |
| 2 | Today Daily Change % | -0.1800 |
| 3 | Today daily open | 1.0660 |
The pair remains strongly bearish on the daily time frame. It trades below the 20 SMA @ 1.0745, 50 SMA 1.0897, 100 SMA @ 1.0881 and 200 SMA @ 1.083.
| Trends | Trends.1 | |
|---|---|---|
| 0 | Daily SMA20 | 1.0745 |
| 1 | Daily SMA50 | 1.0897 |
| 2 | Daily SMA100 | 1.0881 |
| 3 | Daily SMA200 | 1.0830 |
The previous day high was 1.0674 while the previous day low was 1.0617. The daily 38.2% Fib levels comes at 1.0639, expected to provide support. Similarly, the daily 61.8% fib level is at 1.0652, expected to provide resistance.
Note the levels of interest below:
- Pivot support is noted at 1.0627, 1.0594, 1.057
- Pivot resistance is noted at 1.0683, 1.0707, 1.074
| Levels | Levels.1 |
|---|---|
| Previous Daily High | 1.0674 |
| Previous Daily Low | 1.0617 |
| Previous Weekly High | 1.0769 |
| Previous Weekly Low | 1.0632 |
| Previous Monthly High | 1.1065 |
| Previous Monthly Low | 1.0766 |
| Daily Fibonacci 38.2% | 1.0639 |
| Daily Fibonacci 61.8% | 1.0652 |
| Daily Pivot Point S1 | 1.0627 |
| Daily Pivot Point S2 | 1.0594 |
| Daily Pivot Point S3 | 1.0570 |
| Daily Pivot Point R1 | 1.0683 |
| Daily Pivot Point R2 | 1.0707 |
| Daily Pivot Point R3 | 1.0740 |
[/s2If]
Download Nehcap EAWe have two EAs that are operational on our LIVE accounts.
- EA-FIX: Check out the details here. Download EA-FIX . EA-FIX is a non-grid HFT scalper.
- EA-GROWTH: High quality low dd EA using trend grids. Download EA_GROWTHJoin Our Telegram Group


