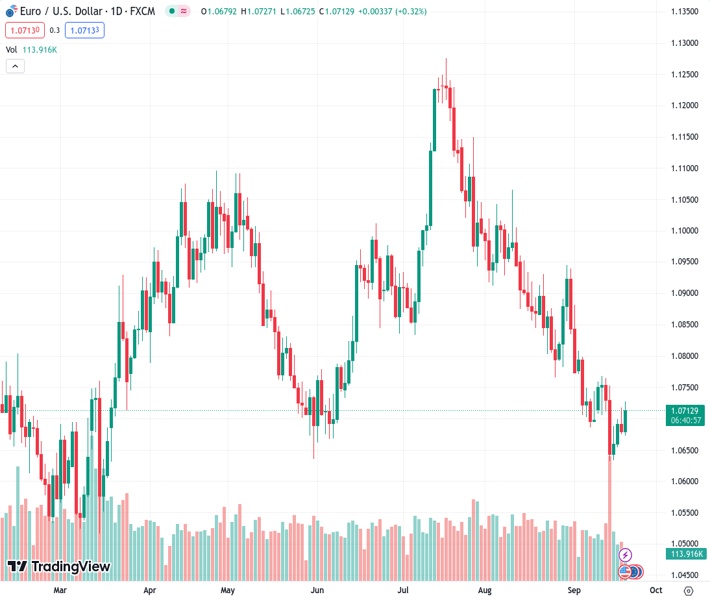
The EURUSD pair, with a value of 1.07135, continues its upward movement above the 1.0700 level.
…
This is a premium post.
[s2If !current_user_can(access_s2member_level4)]Please register for FREE REGISTER to read full post below containing analysis. In case of any error or you think you are not able to read the full post below, please email us at support#nehcap.com [lwa][/s2If] [s2If current_user_can(access_s2member_level1)]
- EUR/USD resumes the upside beyond the 1.0700 barrier.
The pair currently trades last at 1.07135.
The previous day high was 1.0718 while the previous day low was 1.0675. The daily 38.2% Fib levels comes at 1.0691, expected to provide support. Similarly, the daily 61.8% fib level is at 1.0702, expected to provide support.
EUR/USD leaves behind Tuesday’s pullback and reclaims the area above 1.0700 the figure during pre-FOMC trade on Wednesday.
If the rebound gathers extra steam, the pair should face a minor hurdle at the weekly high of 1.0767 (September 12) prior to the critical 200-day SMA at 1.0828.
Despite the so far two-day bounce, the pair’s underlying bearish sentiment remains unchanged and leaves the door open to extra pullbacks in the short-term horizon. Against that backdrop, further losses could see the September low at 1.0631 (September 14) revisited ahead of the March low of 1.0516 (March 15).
While below the key 200-day SMA, the pair is likely to face extra weakness.
Technical Levels: Supports and Resistances
EURUSD currently trading at 1.0705 at the time of writing. Pair opened at 1.068 and is trading with a change of 0.23 % .
| Overview | Overview.1 | |
|---|---|---|
| 0 | Today last price | 1.0705 |
| 1 | Today Daily Change | 37.0000 |
| 2 | Today Daily Change % | 0.2300 |
| 3 | Today daily open | 1.0680 |
The pair remains strongly bearish on the daily time frame. It trades below the 20 SMA @ 1.0763, 50 SMA 1.0918, 100 SMA @ 1.0889 and 200 SMA @ 1.0829.
| Trends | Trends.1 | |
|---|---|---|
| 0 | Daily SMA20 | 1.0763 |
| 1 | Daily SMA50 | 1.0918 |
| 2 | Daily SMA100 | 1.0889 |
| 3 | Daily SMA200 | 1.0829 |
The previous day high was 1.0718 while the previous day low was 1.0675. The daily 38.2% Fib levels comes at 1.0691, expected to provide support. Similarly, the daily 61.8% fib level is at 1.0702, expected to provide support.
Note the levels of interest below:
- Pivot support is noted at 1.0664, 1.0648, 1.0621
- Pivot resistance is noted at 1.0707, 1.0734, 1.075
| Levels | Levels.1 |
|---|---|
| Previous Daily High | 1.0718 |
| Previous Daily Low | 1.0675 |
| Previous Weekly High | 1.0769 |
| Previous Weekly Low | 1.0632 |
| Previous Monthly High | 1.1065 |
| Previous Monthly Low | 1.0766 |
| Daily Fibonacci 38.2% | 1.0691 |
| Daily Fibonacci 61.8% | 1.0702 |
| Daily Pivot Point S1 | 1.0664 |
| Daily Pivot Point S2 | 1.0648 |
| Daily Pivot Point S3 | 1.0621 |
| Daily Pivot Point R1 | 1.0707 |
| Daily Pivot Point R2 | 1.0734 |
| Daily Pivot Point R3 | 1.0750 |
[/s2If]
Download Nehcap EAWe have two EAs that are operational on our LIVE accounts.
- EA-FIX: Check out the details here. Download EA-FIX . EA-FIX is a non-grid HFT scalper.
- EA-GROWTH: High quality low dd EA using trend grids. Download EA_GROWTHJoin Our Telegram Group


