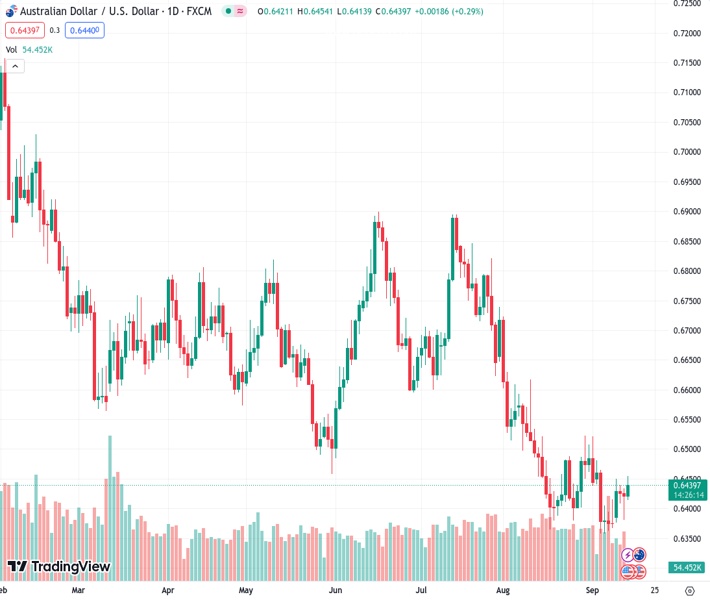
The AUDUSD is currently trading around 0.6435, slightly above the 50- and 100-hour Exponential Moving Averages (EMAs).
…
This is a premium post.
[s2If !current_user_can(access_s2member_level4)]Please register for FREE REGISTER to read full post below containing analysis. In case of any error or you think you are not able to read the full post below, please email us at support#nehcap.com [lwa][/s2If] [s2If current_user_can(access_s2member_level1)]
- AUD/USD trades near 0.6435, holds above the 50- and 100-hour EMAs.
The pair currently trades last at 0.64406.
The previous day high was 0.6434 while the previous day low was 0.638. The daily 38.2% Fib levels comes at 0.6401, expected to provide support. Similarly, the daily 61.8% fib level is at 0.6414, expected to provide support.
The AUD/USD pair attracts some buyers and bounced off the 0.6420 area during the early European session on Thursday. The pair currently trades around 0.6438, gaining 0.25% on the day. The newest Australian employment data have little impact on the Aussie and investors await the US economic data for fresh impetus.
According to the one-hour chart, AUD/USD holds above the 50- and 100-hour Exponential Moving Averages (EMAs) indicating that the path of least resistance for the pair is to the upside.
The immediate resistance level for AUD/USD is seen near the upper boundary of the Bollinger Band and a high of September 13 at the 0.6445-0.6455 zone. Further north, the 0.6500-0.6505 regions appear a tough nut to crack for Aussie bears. The mentioned level represents the confluence of a psychological round mark and a high of August 14. Any meaningful follow-through buying above the latter could pave the way to 0.6522 (high of August 15) and 0.6570 (high of August 9).
On the downside, the 100-hour EMA at 0.6418 acts as an initial support level. The key contention is located at the 0.6400-0.6405 region, representing the lower limit of the Bollinger Band and a psychological round figure. A decisive breach of the latter will see the next stop at 0.6380 (low of August 25) and finally at 0.6365 (low of August 17).
In the meantime, the Relative Strength Index (RSI) stands in bullish territory above 50, challenging the pair’s immediate upside for the time being.
Technical Levels: Supports and Resistances
AUDUSD currently trading at 0.644 at the time of writing. Pair opened at 0.6422 and is trading with a change of 0.28 % .
| Overview | Overview.1 | |
|---|---|---|
| 0 | Today last price | 0.6440 |
| 1 | Today Daily Change | 0.0018 |
| 2 | Today Daily Change % | 0.2800 |
| 3 | Today daily open | 0.6422 |
The pair is trading above its 20 Daily moving average @ 0.6427, below its 50 Daily moving average @ 0.6566 , below its 100 Daily moving average @ 0.6621 and below its 200 Daily moving average @ 0.6708
| Trends | Trends.1 | |
|---|---|---|
| 0 | Daily SMA20 | 0.6427 |
| 1 | Daily SMA50 | 0.6566 |
| 2 | Daily SMA100 | 0.6621 |
| 3 | Daily SMA200 | 0.6708 |
The previous day high was 0.6434 while the previous day low was 0.638. The daily 38.2% Fib levels comes at 0.6401, expected to provide support. Similarly, the daily 61.8% fib level is at 0.6414, expected to provide support.
Note the levels of interest below:
- Pivot support is noted at 0.639, 0.6358, 0.6336
- Pivot resistance is noted at 0.6444, 0.6466, 0.6498
| Levels | Levels.1 |
|---|---|
| Previous Daily High | 0.6434 |
| Previous Daily Low | 0.6380 |
| Previous Weekly High | 0.6480 |
| Previous Weekly Low | 0.6357 |
| Previous Monthly High | 0.6724 |
| Previous Monthly Low | 0.6364 |
| Daily Fibonacci 38.2% | 0.6401 |
| Daily Fibonacci 61.8% | 0.6414 |
| Daily Pivot Point S1 | 0.6390 |
| Daily Pivot Point S2 | 0.6358 |
| Daily Pivot Point S3 | 0.6336 |
| Daily Pivot Point R1 | 0.6444 |
| Daily Pivot Point R2 | 0.6466 |
| Daily Pivot Point R3 | 0.6498 |
[/s2If]
Download Nehcap EAWe have two EAs that are operational on our LIVE accounts.
- EA-FIX: Check out the details here. Download EA-FIX . EA-FIX is a non-grid HFT scalper.
- EA-GROWTH: High quality low dd EA using trend grids. Download EA_GROWTHJoin Our Telegram Group


