Ahead of the release of US CPI data, the gold price at 1,912.75 has bounced back after experiencing recent declines.
…
This is a premium post.
[s2If !current_user_can(access_s2member_level4)]Please register for FREE REGISTER to read full post below containing analysis. In case of any error or you think you are not able to read the full post below, please email us at support#nehcap.com [lwa][/s2If] [s2If current_user_can(access_s2member_level1)]
- XAU/USD recovers from the recent losses ahead of US CPI data.
The pair currently trades last at 1912.75.
The previous day high was 1924.6 while the previous day low was 1907.64. The daily 38.2% Fib levels comes at 1914.12, expected to provide resistance. Similarly, the daily 61.8% fib level is at 1918.12, expected to provide resistance.
Gold price attempts to snap the previous day’s losses, trading higher around $1,910 per troy ounce during the early trading hours of the Asian session on Wednesday. The pair is experiencing an uptick due to the downbeat US Dollar (USD).
However, the prices of Gold face challenges due to the market caution ahead of the release of inflation data from the United States (US), which is scheduled to be released later in the North American session.
The US Consumer Price Index (CPI) is expected to exhibit a 0.5% month-on-month increase, which is an improvement from the previous month’s 0.2% reading. Meanwhile, the Core CPI figure, which excludes volatile food and energy prices, is anticipated to remain steady at 0.2%.
These figures may provide insights into the overall inflationary trends in the US economy and can have an impact on market sentiment and trading decisions on USD-denominated yellow metal.
Investors have been factoring in the possibility of a 25 basis point (bps) interest rate hike by the US Federal Reserve (Fed) in November or December meetings. Along with this, the Fed is expected to sustain higher interest rates over a prolonged period. Higher inflation could reinforce the hawkish sentiment, which may lift the buck and put a selling pressure on the Gold prices.
US Dollar Index (DXY), which measures the performance of the US Dollar (USD) against the other major six currencies, looks to extend its losing streak for the fourth successive trading session. Spot price trades around 104.50 at the time of writing. However, the Greenback is anticipated to remain resilient, supported by the further increase of economic activities in the US.
US Retail Sales growth figures are projected to exhibit a slight slowdown scheduled to be released on Thursday. The market consensus for August shows a 0.2% increase. While this is still a positive number, it represents a decline from the previous month’s growth of 0.7%. These figures may offer insights into consumer spending patterns and can influence market sentiment.
Technical Levels: Supports and Resistances
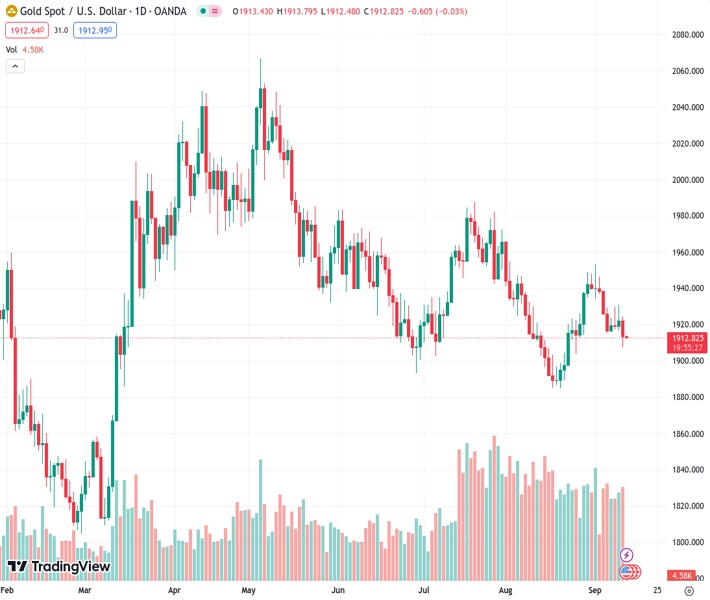
XAUUSD currently trading at 1912.96 at the time of writing. Pair opened at 1913.52 and is trading with a change of -0.03 % .
| Overview | Overview.1 | |
|---|---|---|
| 0 | Today last price | 1912.96 |
| 1 | Today Daily Change | -0.56 |
| 2 | Today Daily Change % | -0.03 |
| 3 | Today daily open | 1913.52 |
The pair remains strongly bearish on the daily time frame. It trades below the 20 SMA @ 1917.33, 50 SMA 1932.0, 100 SMA @ 1949.15 and 200 SMA @ 1920.24.
| Trends | Trends.1 | |
|---|---|---|
| 0 | Daily SMA20 | 1917.33 |
| 1 | Daily SMA50 | 1932.00 |
| 2 | Daily SMA100 | 1949.15 |
| 3 | Daily SMA200 | 1920.24 |
The previous day high was 1924.6 while the previous day low was 1907.64. The daily 38.2% Fib levels comes at 1914.12, expected to provide resistance. Similarly, the daily 61.8% fib level is at 1918.12, expected to provide resistance.
Note the levels of interest below:
- Pivot support is noted at 1905.91, 1898.29, 1888.95
- Pivot resistance is noted at 1922.87, 1932.21, 1939.83
| Levels | Levels.1 |
|---|---|
| Previous Daily High | 1924.60 |
| Previous Daily Low | 1907.64 |
| Previous Weekly High | 1946.35 |
| Previous Weekly Low | 1915.33 |
| Previous Monthly High | 1966.08 |
| Previous Monthly Low | 1884.85 |
| Daily Fibonacci 38.2% | 1914.12 |
| Daily Fibonacci 61.8% | 1918.12 |
| Daily Pivot Point S1 | 1905.91 |
| Daily Pivot Point S2 | 1898.29 |
| Daily Pivot Point S3 | 1888.95 |
| Daily Pivot Point R1 | 1922.87 |
| Daily Pivot Point R2 | 1932.21 |
| Daily Pivot Point R3 | 1939.83 |
[/s2If]
Download Nehcap EAWe have two EAs that are operational on our LIVE accounts.
- EA-FIX: Check out the details here. Download EA-FIX . EA-FIX is a non-grid HFT scalper.
- EA-GROWTH: High quality low dd EA using trend grids. Download EA_GROWTHJoin Our Telegram Group


