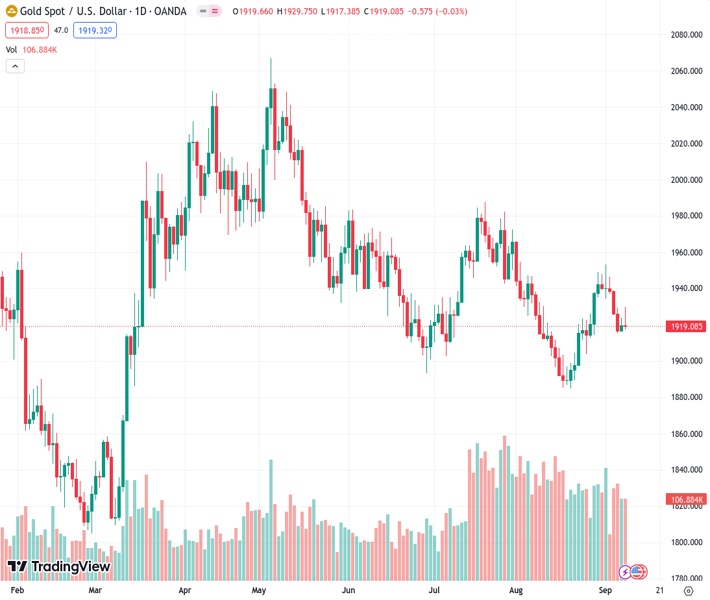
The closing price of XAUUSD at 1,918.90 ended the week with a 1% decrease, which was higher than the combination of the 20-day and 200-day Simple Moving Averages (SMA).
…
This is a premium post.
[s2If !current_user_can(access_s2member_level4)]Please register for FREE REGISTER to read full post below containing analysis. In case of any error or you think you are not able to read the full post below, please email us at support#nehcap.com [lwa][/s2If] [s2If current_user_can(access_s2member_level1)]
- XAU/USD closed the week with a 1% weekly decline above the convergence of the 20 and 200-day SMAs.
The pair currently trades last at 1918.90.
The previous day high was 1923.63 while the previous day low was 1916.29. The daily 38.2% Fib levels comes at 1920.83, expected to provide resistance. Similarly, the daily 61.8% fib level is at 1919.09, expected to provide resistance.
At the end of the week, the XAU/USD traded with mild losses, around $1,918. The precious metal will close the week with sharp losses, 5% for Silver and nearly 1% for Gold driven by US yields edging higher on the back of growing tightening expectations for the Federal Reserve.
In that sense, precious metals tend to be seen as the opportunity cost of holding non-yielding metals, and the US Treasury yields consolidated their weekly rallies on Friday. The 2-year yields stand at 4.99%, while the 5 and 10-year rates are at 4.40% and 4.26%. All three saw mild gains during the session which limited the Gold’s advances on the day.
For next week, investors eagerly await the Consumer Price Index (CPI) and Retail Sales figures from August in the US to continue placing their bets on the next Federal Reserve (Fed) decisions. As for now, markets expect a 25 basis point (bps) hike for the rest of the year but aren’t sure if it will come in November or December. In that sense, the incoming US data will help investors continue modelling their expectations.
The technical outlook for the XAU/USD appears to be neutral to bearish for the short term, with indicators turning flat in negative territory. The neutral slope of the Relative Strength Index (RSI) below 50 further reinforces this mixed sentiment, as does the MACD, which displays stagnant red bars. On the other hand, the metal is battling to consolidate above the convergence of the 20 and 200-day Simple Moving Averages (SMA), so for now, in the larger context, the bulls command.
Support levels: $1,915 (20 and 200-day SMA convergence), $1,900, $1,880.
Resistance levels: $1,930, $1,950 (100-day SMA), $1,970.
Technical Levels: Supports and Resistances
XAUUSD currently trading at 1918.96 at the time of writing. Pair opened at 1919.72 and is trading with a change of -0.04 % .
| Overview | Overview.1 | |
|---|---|---|
| 0 | Today last price | 1918.96 |
| 1 | Today Daily Change | -0.76 |
| 2 | Today Daily Change % | -0.04 |
| 3 | Today daily open | 1919.72 |
The pair is trading above its 20 Daily moving average @ 1915.73, below its 50 Daily moving average @ 1932.23 , below its 100 Daily moving average @ 1951.29 and above its 200 Daily moving average @ 1918.3
| Trends | Trends.1 | |
|---|---|---|
| 0 | Daily SMA20 | 1915.73 |
| 1 | Daily SMA50 | 1932.23 |
| 2 | Daily SMA100 | 1951.29 |
| 3 | Daily SMA200 | 1918.30 |
The previous day high was 1923.63 while the previous day low was 1916.29. The daily 38.2% Fib levels comes at 1920.83, expected to provide resistance. Similarly, the daily 61.8% fib level is at 1919.09, expected to provide resistance.
Note the levels of interest below:
- Pivot support is noted at 1916.13, 1912.54, 1908.79
- Pivot resistance is noted at 1923.47, 1927.22, 1930.81
| Levels | Levels.1 |
|---|---|
| Previous Daily High | 1923.63 |
| Previous Daily Low | 1916.29 |
| Previous Weekly High | 1953.01 |
| Previous Weekly Low | 1912.84 |
| Previous Monthly High | 1966.08 |
| Previous Monthly Low | 1884.85 |
| Daily Fibonacci 38.2% | 1920.83 |
| Daily Fibonacci 61.8% | 1919.09 |
| Daily Pivot Point S1 | 1916.13 |
| Daily Pivot Point S2 | 1912.54 |
| Daily Pivot Point S3 | 1908.79 |
| Daily Pivot Point R1 | 1923.47 |
| Daily Pivot Point R2 | 1927.22 |
| Daily Pivot Point R3 | 1930.81 |
[/s2If]
Download Nehcap EAWe have two EAs that are operational on our LIVE accounts.
- EA-FIX: Check out the details here. Download EA-FIX . EA-FIX is a non-grid HFT scalper.
- EA-GROWTH: High quality low dd EA using trend grids. Download EA_GROWTHJoin Our Telegram Group


