During the Asian session on Friday, the USDCAD currency pair experiences a slight decline due to a small decrease in the value of the US dollar.
…
This is a premium post.
[s2If !current_user_can(access_s2member_level4)]Please register for FREE REGISTER to read full post below containing analysis. In case of any error or you think you are not able to read the full post below, please email us at support#nehcap.com [lwa][/s2If] [s2If current_user_can(access_s2member_level1)]
- USD/CAD drifts lower during the Asian session on Friday amid a modest USD weakness.
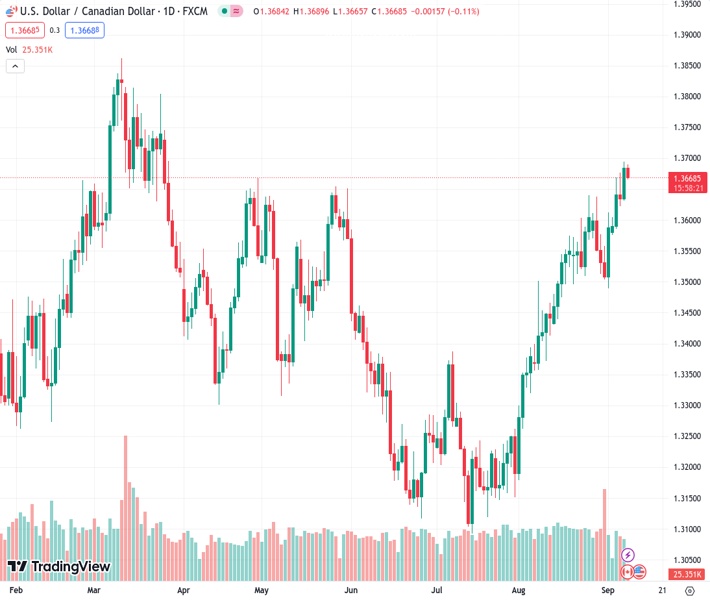
The pair currently trades last at 1.36784.
The previous day high was 1.3694 while the previous day low was 1.3632. The daily 38.2% Fib levels comes at 1.3671, expected to provide support. Similarly, the daily 61.8% fib level is at 1.3656, expected to provide support.
The USD/CAD pair meets with some supply during the Asian session on Friday and erodes a part of the previous day’s strong gains to 1.3700 neighbourhood, or its highest level since March 28. Spot prices currently trade around the 1.3670-1.3665 region, down 0.10% for the day, though the fundamental backdrop warrants some caution for aggressive bearish traders and positioning for any meaningful corrective slide.
A combination of factors prompts some US Dollar (USD) profit-taking, especially after the recent rally to a six-month peak, which, in turn, is seen exerting some downward pressure on the USD/CAD pair. Retreating US Treasury bond yields, along with signs of stability in the equity markets, weigh on the safe-haven Greenback ahead of China inflation data and G20 leaders summit over the weekend. That said, the prospects for further policy tightening by the Federal Reserve (Fed) should act as a tailwind for the US bond yields and the buck.
In fact, the markets seem convinced that the US central bank will keep interest rates higher for longer and have been pricing in the possibility of one more 25 bps lift-off by the end of this year. Moreover, the incoming stronger US macro data, including the US ISM Services PMI on Wednesday and Thursday’s Weekly Jobless Claims, continues to point to a resilient US economy and should allow the Fed to stick to its hawkish stance. This, along with worries about the worsening economic conditions in China, should limit the downside for the Greenback.
Meanwhile, the Bank of Canada (BoC), though signalled that it could raise borrowing costs again to combat inflation, is expected to be relatively quick to cut rates in the wake of signs that the Canadian economy is cooling rapidly. Furthermore, Crude Oil prices remain under some selling pressure for the second straight day and retreat further from the YTD peak touched on Wednesday. This could undermine the commodity-linked Loonie and lend support to the USD/CAD pair ahead of the monthly Canadian jobs data, due later today.
Technical Levels: Supports and Resistances
USDCAD currently trading at 1.3672 at the time of writing. Pair opened at 1.3684 and is trading with a change of -0.09 % .
| Overview | Overview.1 | |
|---|---|---|
| 0 | Today last price | 1.3672 |
| 1 | Today Daily Change | -0.0012 |
| 2 | Today Daily Change % | -0.0900 |
| 3 | Today daily open | 1.3684 |
The pair remains strongly bullish on the daily timeframe. It trades above its 20 SMA @ 1.3559, 50 SMA 1.338, 100 SMA @ 1.3404 and 200 SMA @ 1.3466.
| Trends | Trends.1 | |
|---|---|---|
| 0 | Daily SMA20 | 1.3559 |
| 1 | Daily SMA50 | 1.3380 |
| 2 | Daily SMA100 | 1.3404 |
| 3 | Daily SMA200 | 1.3466 |
The previous day high was 1.3694 while the previous day low was 1.3632. The daily 38.2% Fib levels comes at 1.3671, expected to provide support. Similarly, the daily 61.8% fib level is at 1.3656, expected to provide support.
Note the levels of interest below:
- Pivot support is noted at 1.3646, 1.3608, 1.3584
- Pivot resistance is noted at 1.3709, 1.3733, 1.3771
| Levels | Levels.1 |
|---|---|
| Previous Daily High | 1.3694 |
| Previous Daily Low | 1.3632 |
| Previous Weekly High | 1.3637 |
| Previous Weekly Low | 1.3489 |
| Previous Monthly High | 1.3640 |
| Previous Monthly Low | 1.3184 |
| Daily Fibonacci 38.2% | 1.3671 |
| Daily Fibonacci 61.8% | 1.3656 |
| Daily Pivot Point S1 | 1.3646 |
| Daily Pivot Point S2 | 1.3608 |
| Daily Pivot Point S3 | 1.3584 |
| Daily Pivot Point R1 | 1.3709 |
| Daily Pivot Point R2 | 1.3733 |
| Daily Pivot Point R3 | 1.3771 |
[/s2If]
Download Nehcap EAWe have two EAs that are operational on our LIVE accounts.
- EA-FIX: Check out the details here. Download EA-FIX . EA-FIX is a non-grid HFT scalper.
- EA-GROWTH: High quality low dd EA using trend grids. Download EA_GROWTHJoin Our Telegram Group


