The USDMXN currency pair, currently at a rate of 17.4257, is preparing for its second week in a row of losses as bullish traders test important resistance levels. According to the viewpoint of @nehcap, a pullback is anticipated.
…
This is a premium post.
[s2If !current_user_can(access_s2member_level4)]Please register for FREE REGISTER to read full post below containing analysis. In case of any error or you think you are not able to read the full post below, please email us at support#nehcap.com [lwa][/s2If] [s2If current_user_can(access_s2member_level1)]
- USD/MXN braces for the second consecutive weekly loss as bulls prod key resistance lines.
The pair currently trades last at 17.4257.
The previous day high was 17.4582 while the previous day low was 17.1704. The daily 38.2% Fib levels comes at 17.3483, expected to provide support. Similarly, the daily 61.8% fib level is at 17.2803, expected to provide support.
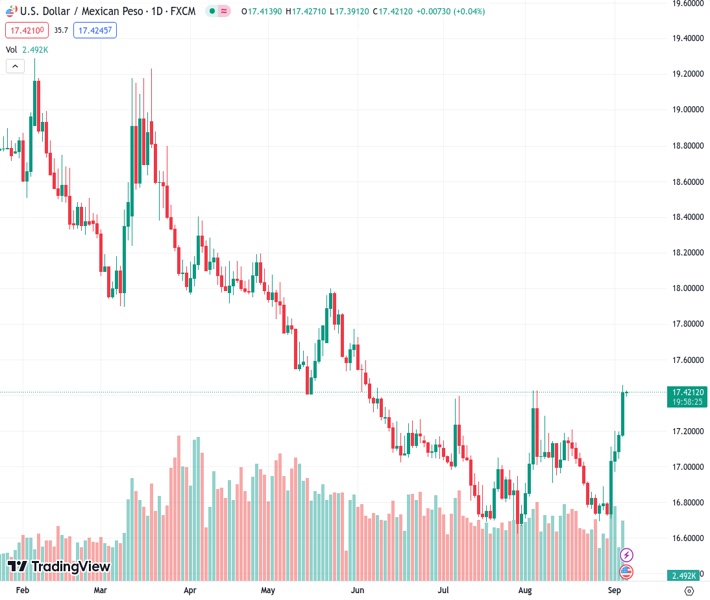
USD/MXN bulls struggle to keep the reins at a three-month high marked the previous day even as the Mexican Peso (MXN) pair edges higher to around 17.42 during early Wednesday.
That said, the quote rose to the highest level since June while fueling the pair toward marking the second consecutive weekly gain amid broad US Dollar strength. However, the overbought RSI and the USD/MXN pair’s failure to provide a daily closing beyond the key technical resistances suggest a pullback in the prices.
Among them, a horizontal line comprising multiple levels marked since mid-May and a two-month-old ascending trend line, respectively around 17.42 and 17.45, gain major attention.
In a case where the USD/MXN pair rises past 17.45, the late May swing high of around 17.76 could act as an intermediate halt during the likely run-up towards the 18.00 threshold.
Meanwhile, pullback moves remain elusive unless breaking an ascending support line from August 31, close to 17.25 by the press time.
Following that, a slew of tops marked in August may test the USD/MXN bears near 17.22 and 17.20 ahead of highlighting the convergence of the 100 and 200 SMAs, close to 16.97 at the latest.
Trend: Pullback expected
Technical Levels: Supports and Resistances
USDMXN currently trading at 17.4114 at the time of writing. Pair opened at 17.4171 and is trading with a change of -0.03% % .
| Overview | Overview.1 | |
|---|---|---|
| 0 | Today last price | 17.4114 |
| 1 | Today Daily Change | -0.0057 |
| 2 | Today Daily Change % | -0.03% |
| 3 | Today daily open | 17.4171 |
The pair is trading above its 20 Daily moving average @ 17.0031, above its 50 Daily moving average @ 16.9795 , above its 100 Daily moving average @ 17.29 and below its 200 Daily moving average @ 18.045
| Trends | Trends.1 | |
|---|---|---|
| 0 | Daily SMA20 | 17.0031 |
| 1 | Daily SMA50 | 16.9795 |
| 2 | Daily SMA100 | 17.2900 |
| 3 | Daily SMA200 | 18.0450 |
The previous day high was 17.4582 while the previous day low was 17.1704. The daily 38.2% Fib levels comes at 17.3483, expected to provide support. Similarly, the daily 61.8% fib level is at 17.2803, expected to provide support.
Note the levels of interest below:
- Pivot support is noted at 17.2389, 17.0607, 16.9511
- Pivot resistance is noted at 17.5268, 17.6364, 17.8146
| Levels | Levels.1 |
|---|---|
| Previous Daily High | 17.4582 |
| Previous Daily Low | 17.1704 |
| Previous Weekly High | 17.2025 |
| Previous Weekly Low | 16.6945 |
| Previous Monthly High | 17.4274 |
| Previous Monthly Low | 16.6945 |
| Daily Fibonacci 38.2% | 17.3483 |
| Daily Fibonacci 61.8% | 17.2803 |
| Daily Pivot Point S1 | 17.2389 |
| Daily Pivot Point S2 | 17.0607 |
| Daily Pivot Point S3 | 16.9511 |
| Daily Pivot Point R1 | 17.5268 |
| Daily Pivot Point R2 | 17.6364 |
| Daily Pivot Point R3 | 17.8146 |
[/s2If]
Download Nehcap EAWe have two EAs that are operational on our LIVE accounts.
- EA-FIX: Check out the details here. Download EA-FIX . EA-FIX is a non-grid HFT scalper.
- EA-GROWTH: High quality low dd EA using trend grids. Download EA_GROWTHJoin Our Telegram Group


