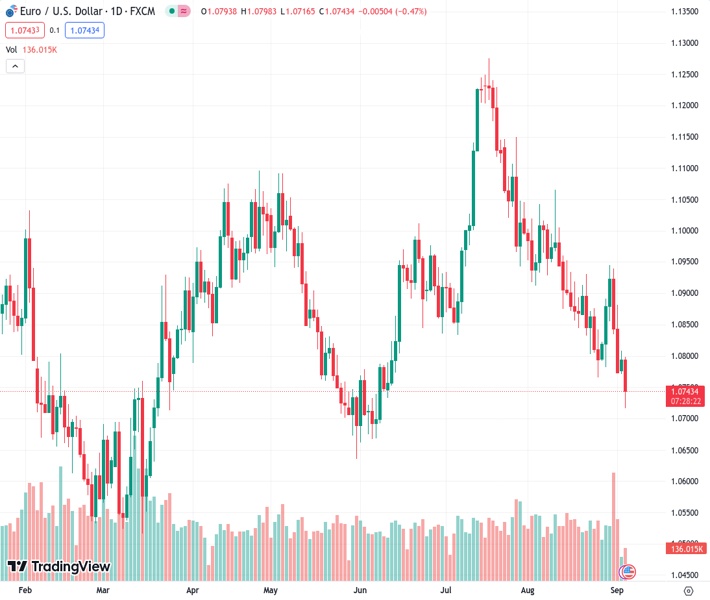
The EUR/USD currency pair, currently trading at 1.07447, is experiencing a faster decrease in value and is now approaching the 1.0715 support level.
…
This is a premium post.
[s2If !current_user_can(access_s2member_level4)]Please register for FREE REGISTER to read full post below containing analysis. In case of any error or you think you are not able to read the full post below, please email us at support#nehcap.com [lwa][/s2If] [s2If current_user_can(access_s2member_level1)]
- EUR/USD sees its decline gather pace and test the 1.0715 level.
The pair currently trades last at 1.07447.
The previous day high was 1.0809 while the previous day low was 1.0772. The daily 38.2% Fib levels comes at 1.0795, expected to provide resistance. Similarly, the daily 61.8% fib level is at 1.0786, expected to provide resistance.
EUR/USD sets aside Monday’s decent bounce and resumes the downtrend on Tuesday.
The sharp retracement seen in the latter part of last week seems to have shifted the attention to the downside once again. Against that, the loss of the 1.0700 support is expected to motivate the pair to challenge the May low of 1.0635 (May 31) in the not-so-distant future.
In the meantime, further losses remain in the pipeline while below the key 200-day SMA, today at 1.0819.
Technical Levels: Supports and Resistances
EURUSD currently trading at 1.0734 at the time of writing. Pair opened at 1.0795 and is trading with a change of -0.57 % .
| Overview | Overview.1 | |
|---|---|---|
| 0 | Today last price | 1.0734 |
| 1 | Today Daily Change | 82.0000 |
| 2 | Today Daily Change % | -0.5700 |
| 3 | Today daily open | 1.0795 |
The pair remains strongly bearish on the daily time frame. It trades below the 20 SMA @ 1.0877, 50 SMA 1.0966, 100 SMA @ 1.0921 and 200 SMA @ 1.0818.
| Trends | Trends.1 | |
|---|---|---|
| 0 | Daily SMA20 | 1.0877 |
| 1 | Daily SMA50 | 1.0966 |
| 2 | Daily SMA100 | 1.0921 |
| 3 | Daily SMA200 | 1.0818 |
The previous day high was 1.0809 while the previous day low was 1.0772. The daily 38.2% Fib levels comes at 1.0795, expected to provide resistance. Similarly, the daily 61.8% fib level is at 1.0786, expected to provide resistance.
Note the levels of interest below:
- Pivot support is noted at 1.0775, 1.0755, 1.0738
- Pivot resistance is noted at 1.0812, 1.0829, 1.0849
| Levels | Levels.1 |
|---|---|
| Previous Daily High | 1.0809 |
| Previous Daily Low | 1.0772 |
| Previous Weekly High | 1.0946 |
| Previous Weekly Low | 1.0772 |
| Previous Monthly High | 1.1065 |
| Previous Monthly Low | 1.0766 |
| Daily Fibonacci 38.2% | 1.0795 |
| Daily Fibonacci 61.8% | 1.0786 |
| Daily Pivot Point S1 | 1.0775 |
| Daily Pivot Point S2 | 1.0755 |
| Daily Pivot Point S3 | 1.0738 |
| Daily Pivot Point R1 | 1.0812 |
| Daily Pivot Point R2 | 1.0829 |
| Daily Pivot Point R3 | 1.0849 |
[/s2If]
Download Nehcap EAWe have two EAs that are operational on our LIVE accounts.
- EA-FIX: Check out the details here. Download EA-FIX . EA-FIX is a non-grid HFT scalper.
- EA-GROWTH: High quality low dd EA using trend grids. Download EA_GROWTHJoin Our Telegram Group


