The EURGBP pair, which was initially at 0.85457, has now reached a new low of 0.8546 in the span of seven days. This decline has been caused by the anticipation of a rate increase by the Bank of England and the European Central Bank’s decision to maintain its current position.
…
This is a premium post.
[s2If !current_user_can(access_s2member_level4)]Please register for FREE REGISTER to read full post below containing analysis. In case of any error or you think you are not able to read the full post below, please email us at support#nehcap.com [lwa][/s2If] [s2If current_user_can(access_s2member_level1)]
- EUR/GBP pair drops to a new seven-day low of 0.8546, influenced by market expectations of a BoE rate hike and ECB’s unchanged stance.
The pair currently trades last at 0.85457.
The previous day high was 0.8573 while the previous day low was 0.8548. The daily 38.2% Fib levels comes at 0.8564, expected to provide resistance. Similarly, the daily 61.8% fib level is at 0.8558, expected to provide resistance.
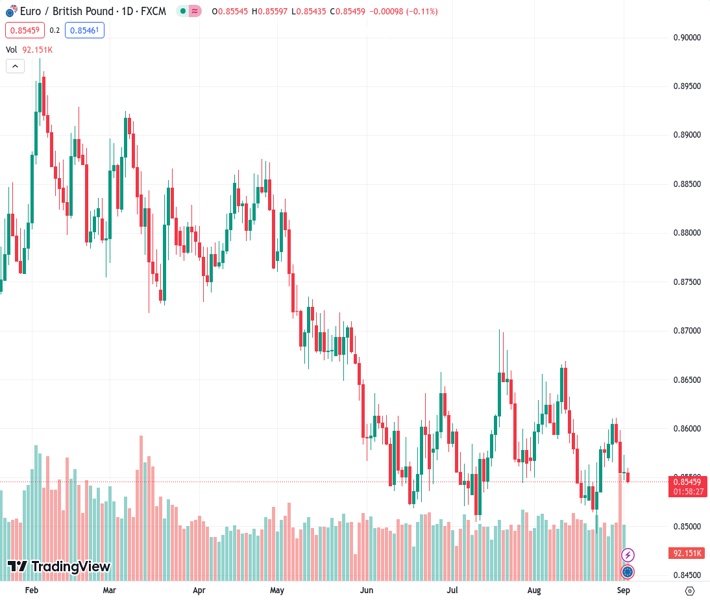
The Euro (EUR) loses ground against the Pound Sterling (GBP) amid a risk-on impulse, as well as expectations for interest rates staying unchanged by the European Central Bank (ECB). At the same time, the Bank of England (BoE) is seen by market analysts as the only one to raise rates by 25 bps in September. That, alongside technical resistance, dragged the EUR/GBP to a new seven-day low, as the pair trades at 0.8546 after hitting a high of 0.8559.
The daily chart portrays the pair tested the 50-day Simple Moving Average (SMA) at 0.8582, but buyers failed to pierce it on the upside, so the cross extended its losses toward current exchange rates. Due to the pair registering a successive series of lower highs and lows, the downtrend is intact, and if the pair breaches the year-to-date (YTD) low of 0.8492, August 24, 2022, would be tested at 0.8408.
On an intraday bias, the EUR/GBP is trending down but is forming a falling wedge, a bullish chart pattern, that could pave the way for further upside. If the cross breaks to the upside, the first resistance would be the 200-hour SMA (HSMA) at 0.8572, followed by the psychological 0.8600 figure and last week’s high of 0.8610.
If the pair manages to remain within the chart pattern, further downside is seen at the bottom of the falling wedge at around 0.8530/20, which, if broken, the EUR/GBP could plunge towards the YTD low of 0.8492.
Technical Levels: Supports and Resistances
EURGBP currently trading at 0.8547 at the time of writing. Pair opened at 0.8559 and is trading with a change of -0.14 % .
| Overview | Overview.1 | |
|---|---|---|
| 0 | Today last price | 0.8547 |
| 1 | Today Daily Change | -0.0012 |
| 2 | Today Daily Change % | -0.1400 |
| 3 | Today daily open | 0.8559 |
The pair remains strongly bearish on the daily time frame. It trades below the 20 SMA @ 0.8578, 50 SMA 0.8585, 100 SMA @ 0.8635 and 200 SMA @ 0.8714.
| Trends | Trends.1 | |
|---|---|---|
| 0 | Daily SMA20 | 0.8578 |
| 1 | Daily SMA50 | 0.8585 |
| 2 | Daily SMA100 | 0.8635 |
| 3 | Daily SMA200 | 0.8714 |
The previous day high was 0.8573 while the previous day low was 0.8548. The daily 38.2% Fib levels comes at 0.8564, expected to provide resistance. Similarly, the daily 61.8% fib level is at 0.8558, expected to provide resistance.
Note the levels of interest below:
- Pivot support is noted at 0.8547, 0.8535, 0.8522
- Pivot resistance is noted at 0.8572, 0.8586, 0.8598
| Levels | Levels.1 |
|---|---|
| Previous Daily High | 0.8573 |
| Previous Daily Low | 0.8548 |
| Previous Weekly High | 0.8611 |
| Previous Weekly Low | 0.8548 |
| Previous Monthly High | 0.8669 |
| Previous Monthly Low | 0.8493 |
| Daily Fibonacci 38.2% | 0.8564 |
| Daily Fibonacci 61.8% | 0.8558 |
| Daily Pivot Point S1 | 0.8547 |
| Daily Pivot Point S2 | 0.8535 |
| Daily Pivot Point S3 | 0.8522 |
| Daily Pivot Point R1 | 0.8572 |
| Daily Pivot Point R2 | 0.8586 |
| Daily Pivot Point R3 | 0.8598 |
[/s2If]
Download Nehcap EAWe have two EAs that are operational on our LIVE accounts.
- EA-FIX: Check out the details here. Download EA-FIX . EA-FIX is a non-grid HFT scalper.
- EA-GROWTH: High quality low dd EA using trend grids. Download EA_GROWTHJoin Our Telegram Group


