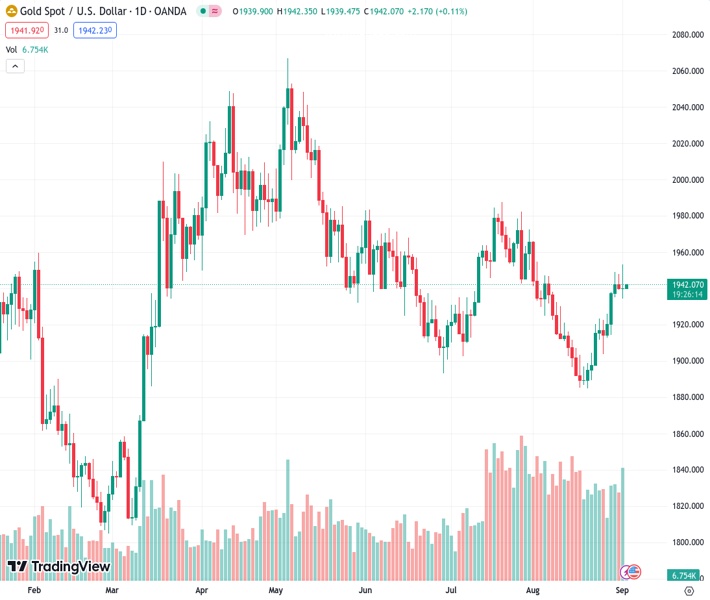
The price of gold, currently at 1,942.03 in the XAUUSD market, is struggling to overcome an important resistance level after a two-week period of increasing prices. According to the viewpoint of @nehcap, it is anticipated that there will be further upward movement.
…
This is a premium post.
[s2If !current_user_can(access_s2member_level4)]Please register for FREE REGISTER to read full post below containing analysis. In case of any error or you think you are not able to read the full post below, please email us at support#nehcap.com [lwa][/s2If] [s2If current_user_can(access_s2member_level1)]
- Gold Price jostles with key upside hurdle after two-week uptrend.
The pair currently trades last at 1942.03.
The previous day high was 1953.01 while the previous day low was 1934.43. The daily 38.2% Fib levels comes at 1941.53, expected to provide support. Similarly, the daily 61.8% fib level is at 1945.91, expected to provide resistance.
Gold Price (XAU/USD) remains mildly bid while picking up bids to reverse the previous day’s pullback from a one-month high amid early Monday. That said, the US Dollar’s retreat amid the US Labor Day Holiday joins the mixed US–China news to underpin the XAU/USD upside around $1,941 of late. It’s worth noting that Friday’s United States data prod the Gold buyers after the metal refreshed the monthly top. Even so, a lack of hawkish bias about the Federal Reserve (Fed) joins China stimulus to keep the bullion buyers hopeful, especially when the technical details are favorable to the upside move.
Gold Price remains on the buyer’s radar as the US Dollar buyers appear running out of steam after seven consecutive weekly gains. Adding strength to the bullish bias about the XAU/USD are stimulus measures from one of the world’s biggest Gold customers, namely China.
Looking back, a downward revision to the Q2 US GDP growth and softer PMIs contrasted with the upbeat prints of inflation clues and mostly impressive employment statistics. With this, the US Dollar managed to close on the positive side for the seventh consecutive week despite marking the lowest weekly gain since early July.
On Friday, the headlines US Nonfarm Payrolls (NFP) rose to 187K in August versus 170K expected and 157K prior (revised) even as the Unemployment Rate marked an uptick to 3.8% from 3.5% market forecasts and previous readings. Further, the Average Hourly Earnings also eased to 0.2% and 4.3% compared to 0.4% and 4.4% respective priors. Additionally, the US ISM Manufacturing PMI also impressed the US Dollar buyers with the 47.6 figures versus analysts’ estimation of 47.0 versus 46.4 previous readings.
Following the data, Federal Reserve Bank of Cleveland President Loretta J. Mester downplayed the increase in the Unemployment Rate to 3.8% by stating that the level “is still low.” The policymaker termed the US job market as strong despite recent rebalancing as she spoke at an event in Germany. About inflation, Fed’s Mester acknowledged that progress has been made but noted it remains elevated.
On the other hand, China’s Caixin Manufacturing PMI for August rose to 51.0 versus 49.3 market forecasts and 49.2 previous readings. On the same line, China’s official NBS Manufacturing PMI for August rose to 49.7 versus 49.4 expected and 49.3 previous readings. However, the Non-Manufacturing PMI came in as 51.0 compared to 51.5 prior readouts and market forecasts of 51.1.
Also, China’s central bank, namely the People’s Bank of China (PBoC), announced a heavy cut to its foreign exchange reserve requirement ratio (FX RRR) to 4% from 6.0% effective from September 15.
That said, a slew of China banks cut interest rates on Yuan deposits to ease the pressure from lower mortgage rates announced previously. Among them, ICBC, China Industrial Bank, Agricultural Bank of China and Bank of China (BoC) gained major attention.
Additionally, Reuters cited four people familiar with the matter to report that China is likely to step up action to revive the country’s property sector.
Recently, the global rating agency Moody’s cuts its economic growth forecasts for China, as well as revised up the US Gross Domestic Product (GDP) predictions in its latest report while the news about the US-China tension and Beijing’s readiness for more stimulus entertain the Gold traders.
It should be observed that the decline in the benchmark US 10-year Treasury bond yields has been inversely related to the Gold Price in the fortnight. That said, the key bond coupons rose to the highest levels since 2007 before retreating in the last two weeks to 4.18%.
Further, the Wall Street benchmarks also improved in the recent few days, despite Friday’s sluggish closing, which in turn allowed the Gold buyers to keep the reins.
Even so, the US Dollar Index (DXY) managed to post a seven-week uptrend and challenged the XAU/USD upside.
Although the US Dollar’s struggle to defend the latest gains joins the China-inspired optimism to underpin the Gold Price upside, traders need more clues to defend the XAU/USD buyers as the sentiment remains fragile. That said, the S&P 500 Futures printed mild losses by the press time and the equity buyers have also lost some of the grounds in the last few days.
As a result, this week’s China inflation data and the US ISM Services PMI will be crucial for the Gold traders to watch for clear directions.
Also read: Gold Price Weekly Forecast: $1,950 stands in the way of an extended uptrend
Gold Price prods a four-month-old descending resistance line surrounding $1,950 while defending the previous week’s sustained trading beyond the 50-day and 100-day Exponential Moving Averages (EMAs).
That said, the bullish signals on the Moving Average Convergence and Divergence (MACD) indicator, as well as an upbeat Relative Strength Index (RSI) line, placed at 14, keep the XAU/USD hopeful of crossing the immediate upside hurdle.
Following that, the Gold Price can quickly rise to a horizontal resistance area comprising multiple levels marked since late May, around $1,985, ahead of targeting the $2,000 round figure.
Meanwhile, a convergence of the 100 and 50 EMA, near $1,930 at the latest, puts a floor under the XAU/USD.
Even if the Gold Price drops below $1,930, a convergence of the 200-EMA and 61.8% Fibonacci retracement of the bullion’s February-May upside, close to $1,908, quickly followed by the $1,900 threshold, will test the bears before giving them control.
It’s worth noting that the previous monthly low of around $1,885 also acts as a downside filter for the XAU/USD.
Trend: Further upside expected
Technical Levels: Supports and Resistances
XAUUSD currently trading at 1941.27 at the time of writing. Pair opened at 1939.76 and is trading with a change of 0.08% % .
| Overview | Overview.1 | |
|---|---|---|
| 0 | Today last price | 1941.27 |
| 1 | Today Daily Change | 1.51 |
| 2 | Today Daily Change % | 0.08% |
| 3 | Today daily open | 1939.76 |
The pair is trading above its 20 Daily moving average @ 1915.12, above its 50 Daily moving average @ 1931.27 , below its 100 Daily moving average @ 1954.29 and above its 200 Daily moving average @ 1914.87
| Trends | Trends.1 | |
|---|---|---|
| 0 | Daily SMA20 | 1915.12 |
| 1 | Daily SMA50 | 1931.27 |
| 2 | Daily SMA100 | 1954.29 |
| 3 | Daily SMA200 | 1914.87 |
The previous day high was 1953.01 while the previous day low was 1934.43. The daily 38.2% Fib levels comes at 1941.53, expected to provide support. Similarly, the daily 61.8% fib level is at 1945.91, expected to provide resistance.
Note the levels of interest below:
- Pivot support is noted at 1931.79, 1923.82, 1913.21
- Pivot resistance is noted at 1950.37, 1960.98, 1968.95
| Levels | Levels.1 |
|---|---|
| Previous Daily High | 1953.01 |
| Previous Daily Low | 1934.43 |
| Previous Weekly High | 1953.01 |
| Previous Weekly Low | 1912.84 |
| Previous Monthly High | 1966.08 |
| Previous Monthly Low | 1884.85 |
| Daily Fibonacci 38.2% | 1941.53 |
| Daily Fibonacci 61.8% | 1945.91 |
| Daily Pivot Point S1 | 1931.79 |
| Daily Pivot Point S2 | 1923.82 |
| Daily Pivot Point S3 | 1913.21 |
| Daily Pivot Point R1 | 1950.37 |
| Daily Pivot Point R2 | 1960.98 |
| Daily Pivot Point R3 | 1968.95 |
[/s2If]
Download Nehcap EAWe have two EAs that are operational on our LIVE accounts.
- EA-FIX: Check out the details here. Download EA-FIX . EA-FIX is a non-grid HFT scalper.
- EA-GROWTH: High quality low dd EA using trend grids. Download EA_GROWTHJoin Our Telegram Group


