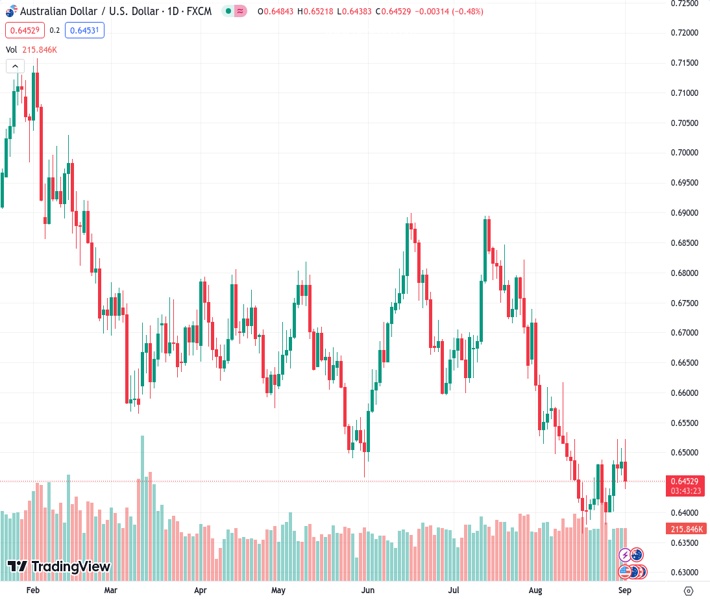
The AUDUSD currency pair, currently at a rate of 0.64524, has fallen back below the 20-day simple moving average (SMA) and is moving towards the level of 0.6450.
…
This is a premium post.
[s2If !current_user_can(access_s2member_level4)]Please register for FREE REGISTER to read full post below containing analysis. In case of any error or you think you are not able to read the full post below, please email us at support#nehcap.com [lwa][/s2If] [s2If current_user_can(access_s2member_level1)]
- AUD/USD retreated below the 20-day SMA towards 0.6450.
The pair currently trades last at 0.64524.
The previous day high was 0.6508 while the previous day low was 0.6461. The daily 38.2% Fib levels comes at 0.649, expected to provide resistance. Similarly, the daily 61.8% fib level is at 0.6479, expected to provide resistance.
In Friday’s session, the USD initially dropped and found support at the 20-day Simple Moving Average (SMA) of 103.30 but then managed to recover towards 104.20. The US reported mixed Nonfarm Payrolls figures and strong PMI figures, while the Australian calendar had nothing relevant to offer, so the USD’s movements primarily directed the pair’s movements.
The Nonfarm Payrolls report, which measures the employment change in non-agricultural business, showed that the US added 187,000 jobs in August, a tick higher than the 170,000 expected and from the previous downwardly revised 157,000. On the negative side, Average Hourly Earnings increased, but slower than expected, while the Unemployment rate rose to 3.8% in the same month.
What drove the USD upwards was the data from the Institute for Supply Management (ISM), which reported higher than expected PMIs from August, with the manufacturing index at 47.6, higher than the 47 expected. The Employment Index also came strong at 48.5 but remains in contraction territory.
As a reaction, the 2,5 and 10-year US Treasury yields fell to their lowest levels in three weeks but then managed to clear their declines after the release of the ISM PMIs. In line with that, the CME FedWatch tool shows that the odds of a hike in the November meeting of the Fed declined to 33% after being around 40% in the last few days. It’s worth highlighting that the market’s volatility on Friday was driven by investors digesting key economic data. Chair Powell from the Federal Reserve (Fed) stated that the ongoing decisions will be decided “carefully” depending on the incoming data.
The AUD/USD daily chart analysis points to a bearish sentiment for the short term. The Relative Strength Index (RSI) is situated below its midline in negative territory, displaying a southward trajectory. Likewise, the Moving Average Convergence Divergence (MACD) reveals red bars, signifying a growing bearish momentum for AUD/USD. Additionally, the pair is below the 20,100 and 200-day Simple Moving Averages (SMAs), indicating that on the broader picture, the bears are still in command, and the buyers have work to do.
Support levels: 0.6430, 0.6400, 0.6390.
Resistance levels: 0.6460 (20-day SMA), 0.6480, 0.6500.
Technical Levels: Supports and Resistances
AUDUSD currently trading at 0.6449 at the time of writing. Pair opened at 0.6484 and is trading with a change of -0.54 % .
| Overview | Overview.1 | |
|---|---|---|
| 0 | Today last price | 0.6449 |
| 1 | Today Daily Change | -0.0035 |
| 2 | Today Daily Change % | -0.5400 |
| 3 | Today daily open | 0.6484 |
The pair remains strongly bearish on the daily time frame. It trades below the 20 SMA @ 0.6471, 50 SMA 0.6611, 100 SMA @ 0.6646 and 200 SMA @ 0.6723.
| Trends | Trends.1 | |
|---|---|---|
| 0 | Daily SMA20 | 0.6471 |
| 1 | Daily SMA50 | 0.6611 |
| 2 | Daily SMA100 | 0.6646 |
| 3 | Daily SMA200 | 0.6723 |
The previous day high was 0.6508 while the previous day low was 0.6461. The daily 38.2% Fib levels comes at 0.649, expected to provide resistance. Similarly, the daily 61.8% fib level is at 0.6479, expected to provide resistance.
Note the levels of interest below:
- Pivot support is noted at 0.6461, 0.6438, 0.6414
- Pivot resistance is noted at 0.6508, 0.6531, 0.6555
| Levels | Levels.1 |
|---|---|
| Previous Daily High | 0.6508 |
| Previous Daily Low | 0.6461 |
| Previous Weekly High | 0.6488 |
| Previous Weekly Low | 0.6380 |
| Previous Monthly High | 0.6724 |
| Previous Monthly Low | 0.6364 |
| Daily Fibonacci 38.2% | 0.6490 |
| Daily Fibonacci 61.8% | 0.6479 |
| Daily Pivot Point S1 | 0.6461 |
| Daily Pivot Point S2 | 0.6438 |
| Daily Pivot Point S3 | 0.6414 |
| Daily Pivot Point R1 | 0.6508 |
| Daily Pivot Point R2 | 0.6531 |
| Daily Pivot Point R3 | 0.6555 |
[/s2If]
Download Nehcap EAWe have two EAs that are operational on our LIVE accounts.
- EA-FIX: Check out the details here. Download EA-FIX . EA-FIX is a non-grid HFT scalper.
- EA-GROWTH: High quality low dd EA using trend grids. Download EA_GROWTHJoin Our Telegram Group


