The EURUSD currency pair rises from Thursday’s small drop and moves towards the level of 1.0900.
…
This is a premium post.
[s2If !current_user_can(access_s2member_level4)]Please register for FREE REGISTER to read full post below containing analysis. In case of any error or you think you are not able to read the full post below, please email us at support#nehcap.com [lwa][/s2If] [s2If current_user_can(access_s2member_level1)]
- EUR/USD fades Thursday’s downtick and approaches 1.0900.
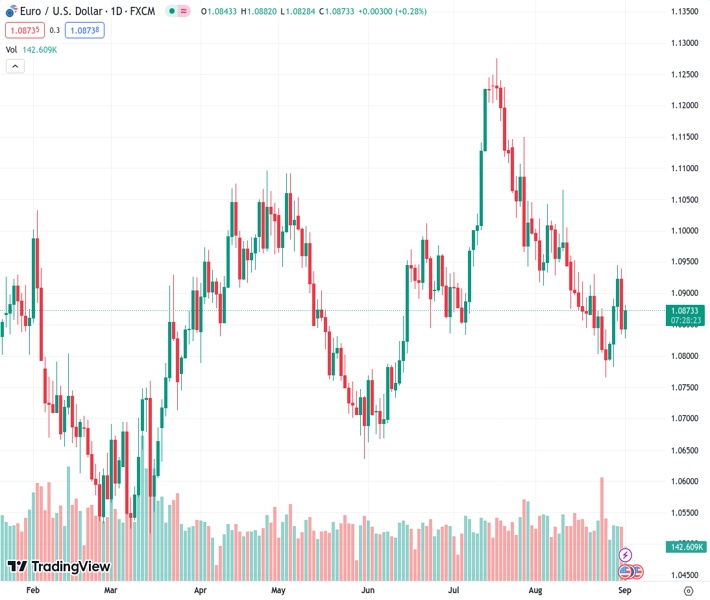
The pair currently trades last at 1.08742.
The previous day high was 1.094 while the previous day low was 1.0835. The daily 38.2% Fib levels comes at 1.0875, expected to provide resistance. Similarly, the daily 61.8% fib level is at 1.09, expected to provide resistance.
EUR/USD manages to set aside part of Thursday’s sharp pullback and gradually approaches the 1.0900 mark on Friday.
Despite the daily knee-jerk, the pair’s current momentum seems to be favouring the continuation of the march north for the time being. That said, the next hurdle emerges at the weekly top at 1.0945 (August 30), prior to the interim 55-day SMA at 1.0965 and the psychological 1.1000 mark.
In the meantime, the pair is likely to keep the bullish outlook unchanged while above the 200-day SMA, today at 1.0816.
Technical Levels: Supports and Resistances
EURUSD currently trading at 1.0867 at the time of writing. Pair opened at 1.0844 and is trading with a change of 0.21 % .
| Overview | Overview.1 | |
|---|---|---|
| 0 | Today last price | 1.0867 |
| 1 | Today Daily Change | 54.0000 |
| 2 | Today Daily Change % | 0.2100 |
| 3 | Today daily open | 1.0844 |
The pair is trading below its 20 Daily moving average @ 1.0899, below its 50 Daily moving average @ 1.097 , below its 100 Daily moving average @ 1.0924 and above its 200 Daily moving average @ 1.0814
| Trends | Trends.1 | |
|---|---|---|
| 0 | Daily SMA20 | 1.0899 |
| 1 | Daily SMA50 | 1.0970 |
| 2 | Daily SMA100 | 1.0924 |
| 3 | Daily SMA200 | 1.0814 |
The previous day high was 1.094 while the previous day low was 1.0835. The daily 38.2% Fib levels comes at 1.0875, expected to provide resistance. Similarly, the daily 61.8% fib level is at 1.09, expected to provide resistance.
Note the levels of interest below:
- Pivot support is noted at 1.0806, 1.0768, 1.0702
- Pivot resistance is noted at 1.091, 1.0977, 1.1015
| Levels | Levels.1 |
|---|---|
| Previous Daily High | 1.0940 |
| Previous Daily Low | 1.0835 |
| Previous Weekly High | 1.0930 |
| Previous Weekly Low | 1.0766 |
| Previous Monthly High | 1.1065 |
| Previous Monthly Low | 1.0766 |
| Daily Fibonacci 38.2% | 1.0875 |
| Daily Fibonacci 61.8% | 1.0900 |
| Daily Pivot Point S1 | 1.0806 |
| Daily Pivot Point S2 | 1.0768 |
| Daily Pivot Point S3 | 1.0702 |
| Daily Pivot Point R1 | 1.0910 |
| Daily Pivot Point R2 | 1.0977 |
| Daily Pivot Point R3 | 1.1015 |
[/s2If]
Download Nehcap EAWe have two EAs that are operational on our LIVE accounts.
- EA-FIX: Check out the details here. Download EA-FIX . EA-FIX is a non-grid HFT scalper.
- EA-GROWTH: High quality low dd EA using trend grids. Download EA_GROWTHJoin Our Telegram Group


