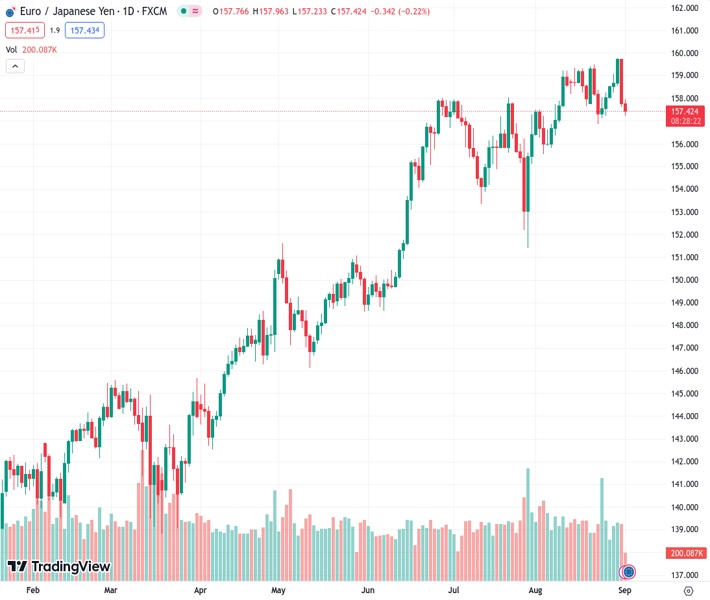
The EURJPY pair, currently at a price of 157.356, experiences an increase in the retracement seen on Thursday and tests the level of 157.30.
…
This is a premium post.
[s2If !current_user_can(access_s2member_level4)]Please register for FREE REGISTER to read full post below containing analysis. In case of any error or you think you are not able to read the full post below, please email us at support#nehcap.com [lwa][/s2If] [s2If current_user_can(access_s2member_level1)]
- EUR/JPY adds to Thursday’s strong pullback and tests 157.30.
The pair currently trades last at 157.356.
The previous day high was 159.75 while the previous day low was 157.62. The daily 38.2% Fib levels comes at 158.43, expected to provide resistance. Similarly, the daily 61.8% fib level is at 158.93, expected to provide resistance.
Further selling pressure forces EUR/JPY to add to Thursday’s losses and print multi-day lows near 157.30 on Friday.
In case the downward bias picks up extra pace, the cross risks an initial drop to the minor support at the weekly low of 156.86 (August 23), which appears so far propped up by the provisional 55-day SMA (156.90).
So far, the longer term positive outlook for the cross appears favoured while above the 200-day SMA, today at 147.98
Technical Levels: Supports and Resistances
EURJPY currently trading at 157.48 at the time of writing. Pair opened at 157.81 and is trading with a change of -0.21 % .
| Overview | Overview.1 | |
|---|---|---|
| 0 | Today last price | 157.48 |
| 1 | Today Daily Change | 64.00 |
| 2 | Today Daily Change % | -0.21 |
| 3 | Today daily open | 157.81 |
The pair is trading below its 20 Daily moving average @ 158.21, above its 50 Daily moving average @ 157.05 , above its 100 Daily moving average @ 153.36 and above its 200 Daily moving average @ 147.95
| Trends | Trends.1 | |
|---|---|---|
| 0 | Daily SMA20 | 158.21 |
| 1 | Daily SMA50 | 157.05 |
| 2 | Daily SMA100 | 153.36 |
| 3 | Daily SMA200 | 147.95 |
The previous day high was 159.75 while the previous day low was 157.62. The daily 38.2% Fib levels comes at 158.43, expected to provide resistance. Similarly, the daily 61.8% fib level is at 158.93, expected to provide resistance.
Note the levels of interest below:
- Pivot support is noted at 157.03, 156.26, 154.9
- Pivot resistance is noted at 159.16, 160.52, 161.3
| Levels | Levels.1 |
|---|---|
| Previous Daily High | 159.75 |
| Previous Daily Low | 157.62 |
| Previous Weekly High | 159.49 |
| Previous Weekly Low | 156.87 |
| Previous Monthly High | 159.76 |
| Previous Monthly Low | 155.53 |
| Daily Fibonacci 38.2% | 158.43 |
| Daily Fibonacci 61.8% | 158.93 |
| Daily Pivot Point S1 | 157.03 |
| Daily Pivot Point S2 | 156.26 |
| Daily Pivot Point S3 | 154.90 |
| Daily Pivot Point R1 | 159.16 |
| Daily Pivot Point R2 | 160.52 |
| Daily Pivot Point R3 | 161.30 |
[/s2If]
Download Nehcap EAWe have two EAs that are operational on our LIVE accounts.
- EA-FIX: Check out the details here. Download EA-FIX . EA-FIX is a non-grid HFT scalper.
- EA-GROWTH: High quality low dd EA using trend grids. Download EA_GROWTHJoin Our Telegram Group


