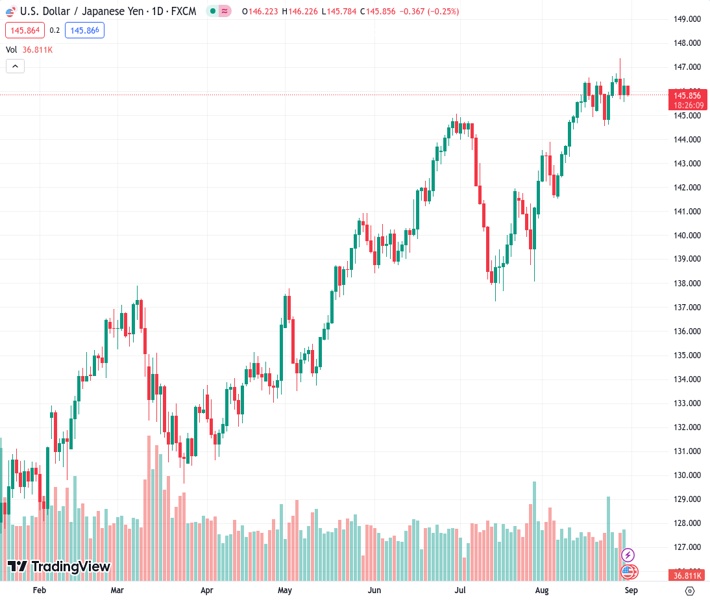
The USDJPY pair at a rate of 145.878 has reversed its bounce from the lowest point of the week, and is now testing a support line that has been trending upwards for the past three weeks.
…
This is a premium post.
[s2If !current_user_can(access_s2member_level4)]Please register for FREE REGISTER to read full post below containing analysis. In case of any error or you think you are not able to read the full post below, please email us at support#nehcap.com [lwa][/s2If] [s2If current_user_can(access_s2member_level1)]
- USD/JPY reverses the previous day’s rebound from weekly low, prods three-week-old rising support line.
The pair currently trades last at 145.878.
The previous day high was 146.54 while the previous day low was 145.56. The daily 38.2% Fib levels comes at 146.16, expected to provide resistance. Similarly, the daily 61.8% fib level is at 145.93, expected to provide resistance.
USD/JPY sellers return to the table, after a brief absence the previous day, as market players expect the Bank of Japan’s (BoJ) exit from the ultra-easy monetary policies. That said, the Yen pair drops to 145.80 as it reverses the previous day’s rebound from a three-week-old ascending support line amid very early Thursday morning in Europe.
It’s worth noting that the latest comments from BoJ Board Member Toyoaki Nakamura renew the hawkish concerns about the BoJ and weigh on the USD/JPY price, especially amid the growing acceptance of the Federal Reserve’s (Fed) policy pivot. “Japan’s economy is no longer in deflation but the deflationary mindset is yet to be eradicated,” said BoJ’s Nakamura.
Apart from the hawkish BoJ concerns, mixed comments from Japan’s government officials about the industrial production conditions also seem to have exerted downside pressure on the USD/JPY price. “Japan government official stated that the factory output in August has undershot risk due to global economic downturn,” reported Reuters.
Elsewhere, US Dollar Index (DXY) remains pressured at 103.10, poking the 200-DMA support while struggling to defend the previous three-day losing streak. That said, the S&P 500 Futures struggle to track Wall Street’s gains amid a cautious mood ahead of the key US data. However, the benchmark US 10-year Treasury bond yields remain pressured at the lowest levels in three weeks, around 4.11% by the press time.
It should noted that the disappointment from initial signals of Friday’s Nonfarm Payrolls (NFP) also lured the USD/JPY bears as the ADP Employment Change dropped to 177K compared to 195K market forecasts and 371K previous readings (revised from 324K). On the same line, the second readings of the US second quarter (Q2) Gross Domestic Product (GDP) Annualized declined to 2.1% from 2.4% initial forecasts while the GDP Price Index also eased to 2.0% versus the first readings of 2.2%. Further, the preliminary readings of the Personal Consumption Expenditures (PCE) Prices also edged lower to 2.5% from 2.6% prior estimations for the said period.
Previously, the US Consumer Confidence and activity data, as well as the housing market numbers, favored dovish calls about the US central bank and weighed on the US Dollar.
Looking ahead, the Fed’s preferred inflation gauge, namely the US Core Personal Consumption Expenditure (PCE) Price Index for August, will be crucial to aptly predict the USD/JPY Price moves. That said, the US Core PCE Price Index for August, expected to remain unchanged at 0.2% MoM but edge higher to 4.2% YoY from 4.1% prior, will be important to watch for intraday directions amid the Fed policy pivot concerns.
A three-week-old rising support line, close to 145.80 by the press time, restricts the immediate downside of the USD/JPY pair but the recovery will be elusive unless the quote stays below 146.50.
Technical Levels: Supports and Resistances
USDJPY currently trading at 145.9 at the time of writing. Pair opened at 146.24 and is trading with a change of -0.23% % .
| Overview | Overview.1 | |
|---|---|---|
| 0 | Today last price | 145.9 |
| 1 | Today Daily Change | -0.34 |
| 2 | Today Daily Change % | -0.23% |
| 3 | Today daily open | 146.24 |
The pair remains strongly bullish on the daily timeframe. It trades above its 20 SMA @ 145.01, 50 SMA 143.13, 100 SMA @ 140.27 and 200 SMA @ 136.76.
| Trends | Trends.1 | |
|---|---|---|
| 0 | Daily SMA20 | 145.01 |
| 1 | Daily SMA50 | 143.13 |
| 2 | Daily SMA100 | 140.27 |
| 3 | Daily SMA200 | 136.76 |
The previous day high was 146.54 while the previous day low was 145.56. The daily 38.2% Fib levels comes at 146.16, expected to provide resistance. Similarly, the daily 61.8% fib level is at 145.93, expected to provide resistance.
Note the levels of interest below:
- Pivot support is noted at 145.69, 145.13, 144.71
- Pivot resistance is noted at 146.67, 147.09, 147.65
| Levels | Levels.1 |
|---|---|
| Previous Daily High | 146.54 |
| Previous Daily Low | 145.56 |
| Previous Weekly High | 146.64 |
| Previous Weekly Low | 144.54 |
| Previous Monthly High | 144.91 |
| Previous Monthly Low | 137.24 |
| Daily Fibonacci 38.2% | 146.16 |
| Daily Fibonacci 61.8% | 145.93 |
| Daily Pivot Point S1 | 145.69 |
| Daily Pivot Point S2 | 145.13 |
| Daily Pivot Point S3 | 144.71 |
| Daily Pivot Point R1 | 146.67 |
| Daily Pivot Point R2 | 147.09 |
| Daily Pivot Point R3 | 147.65 |
[/s2If]
Download Nehcap EAWe have two EAs that are operational on our LIVE accounts.
- EA-FIX: Check out the details here. Download EA-FIX . EA-FIX is a non-grid HFT scalper.
- EA-GROWTH: High quality low dd EA using trend grids. Download EA_GROWTHJoin Our Telegram Group


