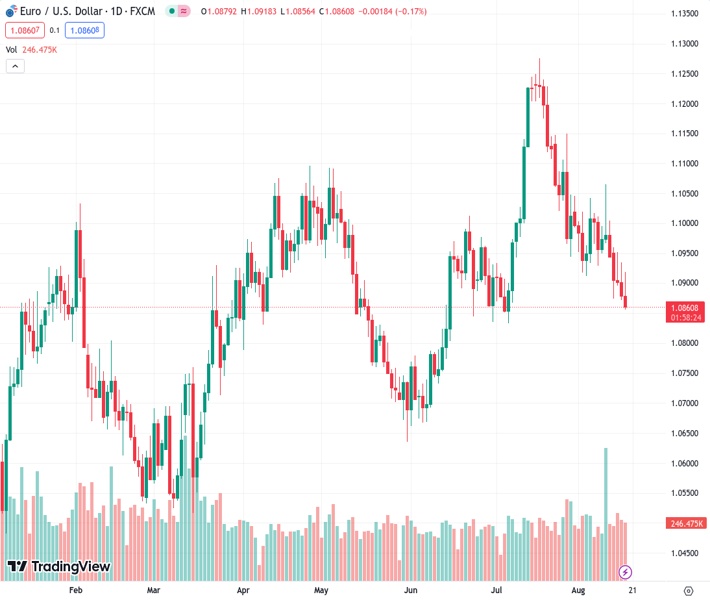
Investors are being cautious in the global market as they expect central banks to increase monetary policy restrictions, leading to a decline in equities and an increase in bond yields. The EUR/USD is currently at 1.08565.
…
This is a premium post.
[s2If !current_user_can(access_s2member_level4)]Please register for FREE REGISTER to read full post below containing analysis. In case of any error or you think you are not able to read the full post below, please email us at support#nehcap.com [lwa][/s2If] [s2If current_user_can(access_s2member_level1)]
- Global market sentiment is cautious, with equities declining and bond yields rising, as investors anticipate further monetary tightening by central banks.
The pair currently trades last at 1.08565.
The previous day high was 1.0934 while the previous day low was 1.0872. The daily 38.2% Fib levels comes at 1.0896, expected to provide resistance. Similarly, the daily 61.8% fib level is at 1.091, expected to provide resistance.
EUR/USD registers modest losses for the fifth straight day, widening its distance from the 1.0900 figure amid a risk-off impulse spurred by the Federal Reserve (Fed) meeting minutes, as well as woes of China’s economic slowdown.
The market sentiment remains downbeat, with global equities slumping while bond yields rise. Investors continued to assess that central banks could continue to tighten monetary conditions.
July’s Fed minutes showed the board members raised rates unanimously, even though some are leaning neutral, expressing worries about lifting rates too high. Most policymakers still see upside inflation risks, yet officials are taking a cautious approach to setting monetary policy, as they emphasized they would consider the “totality” of data to “help clarify the extent to which the disinflation process was continuing.”
Following Wednesday’s data release, the Atlanta Fed GDPNow model portrays the US Q3 2023 GDP at around 5.8%, up from 4.1% on August 8. Given those developments, the swaps market has shown increased chances for a Federal Reserve 25 bps rate hike at the upcoming November meeting.
On Thursday, the US Bureau of Labor Statistics (BLS) showed the last week’s Initial Jobless Claims, which fell to 239K, a tick lower than forecasts of 240K. At the same, the Philadelphia Fed Manufacturing Index for August improved, with numbers hitting 12, exceeding the -10 contraction expected by analysts.
On the Eurozone (EU) front, the Trade Balance depicted a surplus of €23B, exceeding estimates of €18.3B. Before the weekend, the EU would report the Harmonized Index of Consumer Prices (HICP) for July, with estimates of 5.3% YoY and 0.3% MoM. Core HICP is expected to remain sticky at 5.5% YoY.
EURUSD is set to test the July 6 daily low of 1.0833 in the near term. Still, the EUR/USD 1.0800 figure should be up for grabs, followed by the 200-day Moving Average (DMA) at 1.0787. further downside is expected below the latter, as the 1.0700 psychological level would be up next. Conversely, the EUR/USD first resistance emerges at 1.0900, followed by the 50-DMA at 1.0974.
Technical Levels: Supports and Resistances
EURUSD currently trading at 1.0862 at the time of writing. Pair opened at 1.0879 and is trading with a change of -0.16 % .
| Overview | Overview.1 | |
|---|---|---|
| 0 | Today last price | 1.0862 |
| 1 | Today Daily Change | -0.0017 |
| 2 | Today Daily Change % | -0.1600 |
| 3 | Today daily open | 1.0879 |
The pair is trading below its 20 Daily moving average @ 1.0994, below its 50 Daily moving average @ 1.0973 , below its 100 Daily moving average @ 1.0931 and above its 200 Daily moving average @ 1.0785
| Trends | Trends.1 | |
|---|---|---|
| 0 | Daily SMA20 | 1.0994 |
| 1 | Daily SMA50 | 1.0973 |
| 2 | Daily SMA100 | 1.0931 |
| 3 | Daily SMA200 | 1.0785 |
The previous day high was 1.0934 while the previous day low was 1.0872. The daily 38.2% Fib levels comes at 1.0896, expected to provide resistance. Similarly, the daily 61.8% fib level is at 1.091, expected to provide resistance.
Note the levels of interest below:
- Pivot support is noted at 1.0856, 1.0832, 1.0793
- Pivot resistance is noted at 1.0919, 1.0958, 1.0982
| Levels | Levels.1 |
|---|---|
| Previous Daily High | 1.0934 |
| Previous Daily Low | 1.0872 |
| Previous Weekly High | 1.1065 |
| Previous Weekly Low | 1.0929 |
| Previous Monthly High | 1.1276 |
| Previous Monthly Low | 1.0834 |
| Daily Fibonacci 38.2% | 1.0896 |
| Daily Fibonacci 61.8% | 1.0910 |
| Daily Pivot Point S1 | 1.0856 |
| Daily Pivot Point S2 | 1.0832 |
| Daily Pivot Point S3 | 1.0793 |
| Daily Pivot Point R1 | 1.0919 |
| Daily Pivot Point R2 | 1.0958 |
| Daily Pivot Point R3 | 1.0982 |
[/s2If]
Download Nehcap EAWe have two EAs that are operational on our LIVE accounts.
- EA-FIX: Check out the details here. Download EA-FIX . EA-FIX is a non-grid HFT scalper.
- EA-GROWTH: High quality low dd EA using trend grids. Download EA_GROWTHJoin Our Telegram Group


