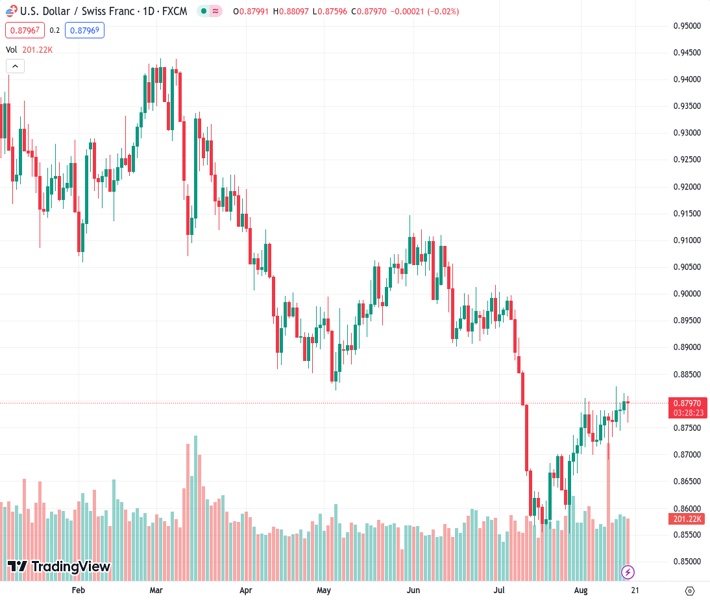
The USDCHF currency pair, with a value of 0.87969, dropped below 0.8800 and reached a low point of 0.8760 for the day.
…
This is a premium post.
[s2If !current_user_can(access_s2member_level4)]Please register for FREE REGISTER to read full post below containing analysis. In case of any error or you think you are not able to read the full post below, please email us at support#nehcap.com [lwa][/s2If] [s2If current_user_can(access_s2member_level1)]
- USD/CHF fell below 0.8800 and hit a daily low of 0.8760.
The pair currently trades last at 0.87969.
The previous day high was 0.8814 while the previous day low was 0.8774. The daily 38.2% Fib levels comes at 0.8799, expected to provide resistance. Similarly, the daily 61.8% fib level is at 0.879, expected to provide support.
On Thursday, the USD/CHF lost ground as the USD seemed to be consolidating gains. The USD DXY index rose to its highest level since January at 103.60, mainly driven by hawkish bets on the Federal Reserve (Fed) and rising US yields. On the CHF’s side, investors await Friday’s Industrial Production figures from Q2.
The strength of the USD is propelled by the rising US yields due to investors betting on the Fed hiking at least once more in this cycle. The US 10-year bond yield surged to its highest level since October 2022, standing at 4.28%, and the 2 and 5-year yields have also experienced upward movements, hitting monthly peaks of 4.95% and 4.40%, respectively.
In line with that, the Federal Open Market Committee (FOMC) minutes showed that members are concerned with a hot labour market threatening inflation, leaving the door open to another hike. That said, the Jobless Claims for the second week of August from the US rose to 239,000 compared to the projected 240,000, marking a decline from the preceding weekly figure of 250,000. As for now, markets are confident that the Fed won’t hike in September, but the probabilities of an increase in November rise to nearly 40%, according to the CME FedWatch tool.
Analysing the daily chart, USD/CHF exhibits signs of bullish exhaustion, contributing to a neutral to bearish technical perspective. The Relative Strength Index (RSI) maintains a negative slope above its midline, while the Moving Average Convergence Divergence (MACD) displays fading green bars. Additionally, the pair is above the 20-day Simple Moving Average (SMA), but below the 100 and 200-day Simple Moving Average (SMAs), indicating that the bulls aren’t done yet and that the outlook is still positive for the short term.
Support levels: 0.8760, 0.8750, 0.8725 (20-day SMA).
Resistance levels: 0.8800, 0.8815, 0.8830.
Technical Levels: Supports and Resistances
USDCHF currently trading at 0.8798 at the time of writing. Pair opened at 0.88 and is trading with a change of -0.02 % .
| Overview | Overview.1 | |
|---|---|---|
| 0 | Today last price | 0.8798 |
| 1 | Today Daily Change | -0.0002 |
| 2 | Today Daily Change % | -0.0200 |
| 3 | Today daily open | 0.8800 |
The pair is trading above its 20 Daily moving average @ 0.8727, below its 50 Daily moving average @ 0.8825 , below its 100 Daily moving average @ 0.891 and below its 200 Daily moving average @ 0.9107
| Trends | Trends.1 | |
|---|---|---|
| 0 | Daily SMA20 | 0.8727 |
| 1 | Daily SMA50 | 0.8825 |
| 2 | Daily SMA100 | 0.8910 |
| 3 | Daily SMA200 | 0.9107 |
The previous day high was 0.8814 while the previous day low was 0.8774. The daily 38.2% Fib levels comes at 0.8799, expected to provide resistance. Similarly, the daily 61.8% fib level is at 0.879, expected to provide support.
Note the levels of interest below:
- Pivot support is noted at 0.8778, 0.8756, 0.8738
- Pivot resistance is noted at 0.8818, 0.8836, 0.8858
| Levels | Levels.1 |
|---|---|
| Previous Daily High | 0.8814 |
| Previous Daily Low | 0.8774 |
| Previous Weekly High | 0.8783 |
| Previous Weekly Low | 0.8690 |
| Previous Monthly High | 0.9005 |
| Previous Monthly Low | 0.8552 |
| Daily Fibonacci 38.2% | 0.8799 |
| Daily Fibonacci 61.8% | 0.8790 |
| Daily Pivot Point S1 | 0.8778 |
| Daily Pivot Point S2 | 0.8756 |
| Daily Pivot Point S3 | 0.8738 |
| Daily Pivot Point R1 | 0.8818 |
| Daily Pivot Point R2 | 0.8836 |
| Daily Pivot Point R3 | 0.8858 |
[/s2If]
Download Nehcap EAWe have two EAs that are operational on our LIVE accounts.
- EA-FIX: Check out the details here. Download EA-FIX . EA-FIX is a non-grid HFT scalper.
- EA-GROWTH: High quality low dd EA using trend grids. Download EA_GROWTHJoin Our Telegram Group


