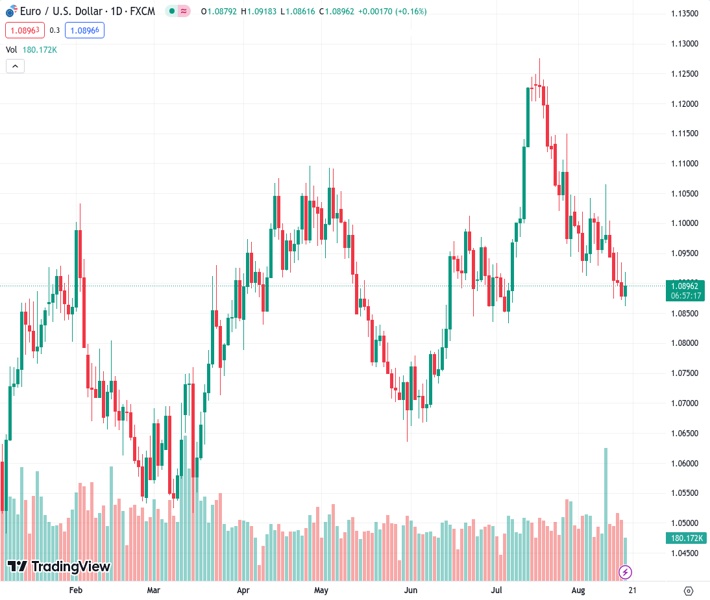
The EURUSD pair has shown renewed strength and started to gain momentum again, recovering from its recent low point close to 1.0860.
…
This is a premium post.
[s2If !current_user_can(access_s2member_level4)]Please register for FREE REGISTER to read full post below containing analysis. In case of any error or you think you are not able to read the full post below, please email us at support#nehcap.com [lwa][/s2If] [s2If current_user_can(access_s2member_level1)]
- EUR/USD regains traction after bottoming out near 1.0860.
The pair currently trades last at 1.08972.
The previous day high was 1.0934 while the previous day low was 1.0872. The daily 38.2% Fib levels comes at 1.0896, expected to provide support. Similarly, the daily 61.8% fib level is at 1.091, expected to provide resistance.
EUR/USD reverses four consecutive sessions of losses and regains the area beyond 1.0900 the figure on Thursday.
If the rebound gathers extra steam, it could encourage the pair to dispute the interim 55-day SMA at 1.0951 prior to the weekly peak at 1.1065 (August 10). Further north from here comes the weekly high of 1.1149 (July 27). Once this region is cleared, the pair’s downside pressure is expected to mitigate.
Looking at the longer run, the positive view remains unchanged while above the 200-day SMA, today at 1.0787.
Technical Levels: Supports and Resistances
EURUSD currently trading at 1.091 at the time of writing. Pair opened at 1.0879 and is trading with a change of 0.28 % .
| Overview | Overview.1 | |
|---|---|---|
| 0 | Today last price | 1.0910 |
| 1 | Today Daily Change | 57.0000 |
| 2 | Today Daily Change % | 0.2800 |
| 3 | Today daily open | 1.0879 |
The pair is trading below its 20 Daily moving average @ 1.0994, below its 50 Daily moving average @ 1.0973 , below its 100 Daily moving average @ 1.0931 and above its 200 Daily moving average @ 1.0785
| Trends | Trends.1 | |
|---|---|---|
| 0 | Daily SMA20 | 1.0994 |
| 1 | Daily SMA50 | 1.0973 |
| 2 | Daily SMA100 | 1.0931 |
| 3 | Daily SMA200 | 1.0785 |
The previous day high was 1.0934 while the previous day low was 1.0872. The daily 38.2% Fib levels comes at 1.0896, expected to provide support. Similarly, the daily 61.8% fib level is at 1.091, expected to provide resistance.
Note the levels of interest below:
- Pivot support is noted at 1.0856, 1.0832, 1.0793
- Pivot resistance is noted at 1.0919, 1.0958, 1.0982
| Levels | Levels.1 |
|---|---|
| Previous Daily High | 1.0934 |
| Previous Daily Low | 1.0872 |
| Previous Weekly High | 1.1065 |
| Previous Weekly Low | 1.0929 |
| Previous Monthly High | 1.1276 |
| Previous Monthly Low | 1.0834 |
| Daily Fibonacci 38.2% | 1.0896 |
| Daily Fibonacci 61.8% | 1.0910 |
| Daily Pivot Point S1 | 1.0856 |
| Daily Pivot Point S2 | 1.0832 |
| Daily Pivot Point S3 | 1.0793 |
| Daily Pivot Point R1 | 1.0919 |
| Daily Pivot Point R2 | 1.0958 |
| Daily Pivot Point R3 | 1.0982 |
[/s2If]
Download Nehcap EAWe have two EAs that are operational on our LIVE accounts.
- EA-FIX: Check out the details here. Download EA-FIX . EA-FIX is a non-grid HFT scalper.
- EA-GROWTH: High quality low dd EA using trend grids. Download EA_GROWTHJoin Our Telegram Group


