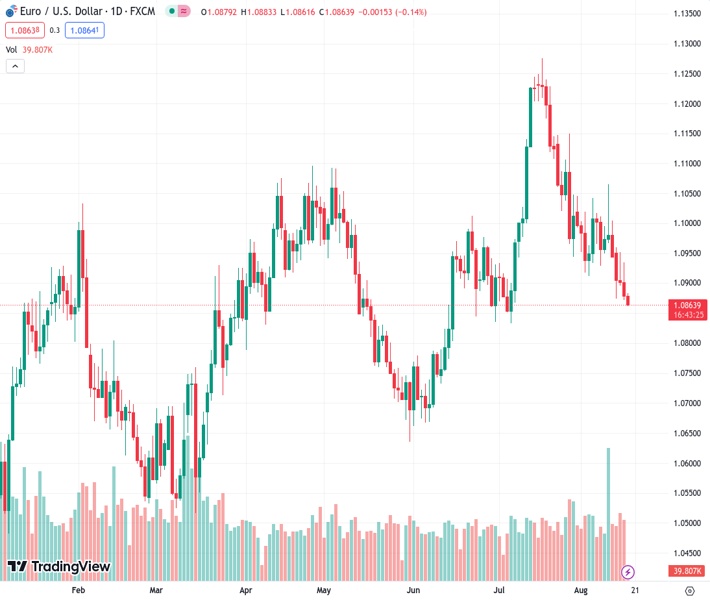
The EURUSD currency pair continues to decline below the 1.0870 level, which is its lowest point in several weeks.
…
This is a premium post.
[s2If !current_user_can(access_s2member_level4)]Please register for FREE REGISTER to read full post below containing analysis. In case of any error or you think you are not able to read the full post below, please email us at support#nehcap.com [lwa][/s2If] [s2If current_user_can(access_s2member_level1)]
- EUR/USD pair extends its loss below the 1.0870 level, a multi-week low.
The pair currently trades last at 1.08633.
The previous day high was 1.0934 while the previous day low was 1.0872. The daily 38.2% Fib levels comes at 1.0896, expected to provide resistance. Similarly, the daily 61.8% fib level is at 1.091, expected to provide resistance.
The EUR/USD pair remains under selling pressure and trades on a negative note for the fifth consecutive day during the Asian session on Thursday. The major pair currently trades around 1.0863, losing 0.14% on the day.
On Wednesday, the preliminary Eurozone Gross Domestic Product (GDP) for the second quarter came in at 0.3% and 0.6% YoY, matching expectations. Meanwhile, Eurozone Industrial Production for June MoM improved to 0.5% versus -0.1% market consensus and 0.0% prior. The monthly Industrial Output data rose by 0.5% versus the estimation of a 0.1% decline.
Earlier this week, the Eurozone ZEW Survey Economic Sentiment for August came in at -5.5, better than the estimation of -12 and the previous reading of -12.2. While the German ZEW Survey Economic Sentiment for August improved to -12.3 versus -14.4 expected and -14.7 prior. The stronger-than-expected data from the Eurozone failed to lift the Euro against its rivals as the prospects for economic growth and inflation are still uncertain.
That said, the upbeat US data and the possibility of a further tightening cycle from the Federal Reserve (Fed) are the main drivers of the US Dollar’s (USD) strength. US Industrial Production rose 1.0% in July, better than market expectations of 0.3% and a prior decrease of 0.8%. Additionally, Building Permits for July increased from 1.44 million to 1.44 million, while Housing Starts increased from 1.39 million in June to 1.45 million, above expectations of 1.48 million. Both reports came in above market expectations and prior readings.
Furthermore, the Federal Open Market Committee (FOMC) Minutes emphasised that inflation remained unacceptably high. The Fed official saw significant inflationary risks, and it may need additional tightening of monetary policy to bring inflation to the longer-run target. In response to the data, the Euro continued to weaken against the US Dollar which acts as a headwind for the EUR/USD pair.
Federal Reserve officials endorsed that future rate decisions would be based on the incoming data, but they would be more cautious in the coming months. Hence, market participants will focus on the US weekly Initial Jobless Claims and the Philadelphia Fed Manufacturing Survey for August, due later in the day. On the Euro docket, Eurozone Trade Balance, the European Central Bank (ECB) Philip Lane speech, and the monthly Harmonized Index of Consumer Prices (HICP) for July will be released in the rest of the week.
Technical Levels: Supports and Resistances
EURUSD currently trading at 1.0864 at the time of writing. Pair opened at 1.0879 and is trading with a change of -0.14 % .
| Overview | Overview.1 | |
|---|---|---|
| 0 | Today last price | 1.0864 |
| 1 | Today Daily Change | -0.0015 |
| 2 | Today Daily Change % | -0.1400 |
| 3 | Today daily open | 1.0879 |
The pair is trading below its 20 Daily moving average @ 1.0994, below its 50 Daily moving average @ 1.0973 , below its 100 Daily moving average @ 1.0931 and above its 200 Daily moving average @ 1.0785
| Trends | Trends.1 | |
|---|---|---|
| 0 | Daily SMA20 | 1.0994 |
| 1 | Daily SMA50 | 1.0973 |
| 2 | Daily SMA100 | 1.0931 |
| 3 | Daily SMA200 | 1.0785 |
The previous day high was 1.0934 while the previous day low was 1.0872. The daily 38.2% Fib levels comes at 1.0896, expected to provide resistance. Similarly, the daily 61.8% fib level is at 1.091, expected to provide resistance.
Note the levels of interest below:
- Pivot support is noted at 1.0856, 1.0832, 1.0793
- Pivot resistance is noted at 1.0919, 1.0958, 1.0982
| Levels | Levels.1 |
|---|---|
| Previous Daily High | 1.0934 |
| Previous Daily Low | 1.0872 |
| Previous Weekly High | 1.1065 |
| Previous Weekly Low | 1.0929 |
| Previous Monthly High | 1.1276 |
| Previous Monthly Low | 1.0834 |
| Daily Fibonacci 38.2% | 1.0896 |
| Daily Fibonacci 61.8% | 1.0910 |
| Daily Pivot Point S1 | 1.0856 |
| Daily Pivot Point S2 | 1.0832 |
| Daily Pivot Point S3 | 1.0793 |
| Daily Pivot Point R1 | 1.0919 |
| Daily Pivot Point R2 | 1.0958 |
| Daily Pivot Point R3 | 1.0982 |
[/s2If]
Download Nehcap EAWe have two EAs that are operational on our LIVE accounts.
- EA-FIX: Check out the details here. Download EA-FIX . EA-FIX is a non-grid HFT scalper.
- EA-GROWTH: High quality low dd EA using trend grids. Download EA_GROWTHJoin Our Telegram Group


