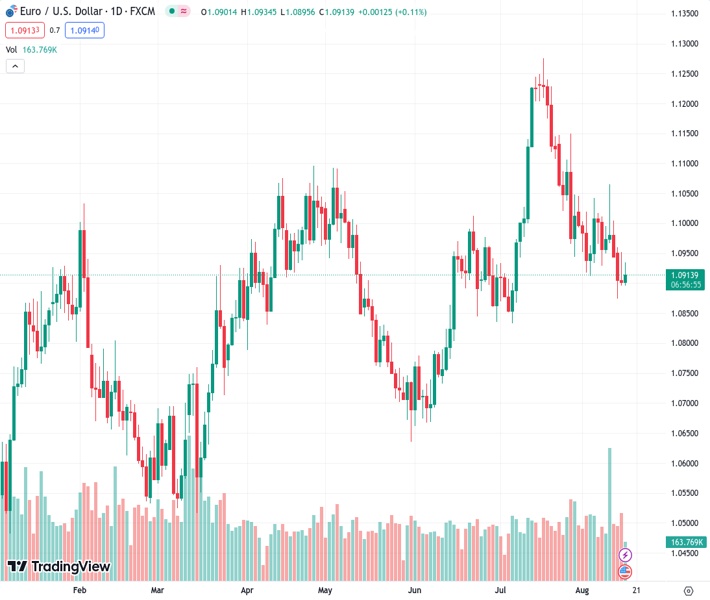
The EUR/USD currency pair, currently at a rate of 1.09087, is losing momentum after previously rising towards the 1.0930 area.
…
This is a premium post.
[s2If !current_user_can(access_s2member_level4)]Please register for FREE REGISTER to read full post below containing analysis. In case of any error or you think you are not able to read the full post below, please email us at support#nehcap.com [lwa][/s2If] [s2If current_user_can(access_s2member_level1)]
- EUR/USD fades the earlier advance to the 1.0930 zone.
The pair currently trades last at 1.09087.
The previous day high was 1.0952 while the previous day low was 1.0897. The daily 38.2% Fib levels comes at 1.0931, expected to provide resistance. Similarly, the daily 61.8% fib level is at 1.0918, expected to provide resistance.
EUR/USD attempts to leave behind three consecutive sessions of losses on Wednesday.
If the rebound gathers extra steam, it could encourage the pair to dispute the weekly peak at 1.1065 (August 10). Further north from here comes the weekly high of 1.1149 (July 27). Once this region is cleared, the pair’s downside pressure is expected to alleviate.
Looking at the longer run, the positive view remains unchanged while above the 200-day SMA, today at 1.0784.
Technical Levels: Supports and Resistances
EURUSD currently trading at 1.0909 at the time of writing. Pair opened at 1.0907 and is trading with a change of 0.02 % .
| Overview | Overview.1 | |
|---|---|---|
| 0 | Today last price | 1.0909 |
| 1 | Today Daily Change | 38.0000 |
| 2 | Today Daily Change % | 0.0200 |
| 3 | Today daily open | 1.0907 |
The pair is trading below its 20 Daily moving average @ 1.101, below its 50 Daily moving average @ 1.097 , below its 100 Daily moving average @ 1.0931 and above its 200 Daily moving average @ 1.0781
| Trends | Trends.1 | |
|---|---|---|
| 0 | Daily SMA20 | 1.1010 |
| 1 | Daily SMA50 | 1.0970 |
| 2 | Daily SMA100 | 1.0931 |
| 3 | Daily SMA200 | 1.0781 |
The previous day high was 1.0952 while the previous day low was 1.0897. The daily 38.2% Fib levels comes at 1.0931, expected to provide resistance. Similarly, the daily 61.8% fib level is at 1.0918, expected to provide resistance.
Note the levels of interest below:
- Pivot support is noted at 1.0885, 1.0864, 1.083
- Pivot resistance is noted at 1.094, 1.0974, 1.0996
| Levels | Levels.1 |
|---|---|
| Previous Daily High | 1.0952 |
| Previous Daily Low | 1.0897 |
| Previous Weekly High | 1.1065 |
| Previous Weekly Low | 1.0929 |
| Previous Monthly High | 1.1276 |
| Previous Monthly Low | 1.0834 |
| Daily Fibonacci 38.2% | 1.0931 |
| Daily Fibonacci 61.8% | 1.0918 |
| Daily Pivot Point S1 | 1.0885 |
| Daily Pivot Point S2 | 1.0864 |
| Daily Pivot Point S3 | 1.0830 |
| Daily Pivot Point R1 | 1.0940 |
| Daily Pivot Point R2 | 1.0974 |
| Daily Pivot Point R3 | 1.0996 |
[/s2If]
Download Nehcap EAWe have two EAs that are operational on our LIVE accounts.
- EA-FIX: Check out the details here. Download EA-FIX . EA-FIX is a non-grid HFT scalper.
- EA-GROWTH: High quality low dd EA using trend grids. Download EA_GROWTHJoin Our Telegram Group


