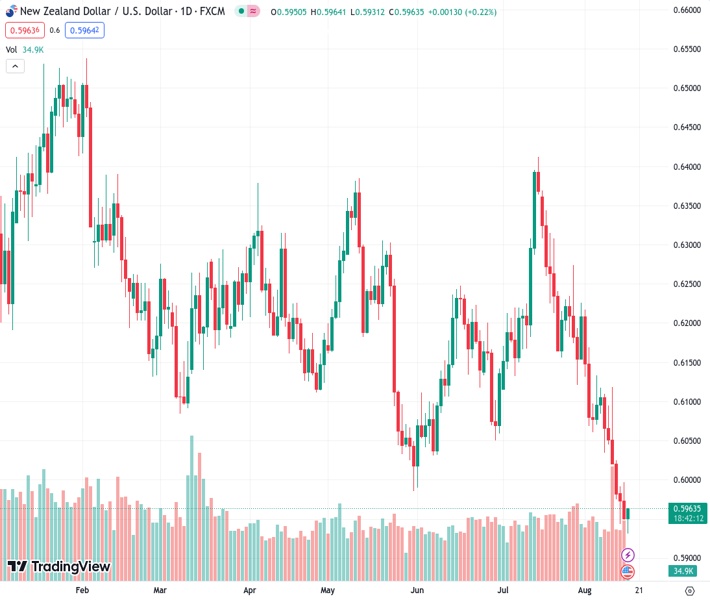
The currency pair NZDUSD, currently trading at 0.59623, is bouncing back from its lowest level of the year, despite the Reserve Bank of New Zealand (RBNZ) deciding not to change their monetary policy.
…
This is a premium post.
[s2If !current_user_can(access_s2member_level4)]Please register for FREE REGISTER to read full post below containing analysis. In case of any error or you think you are not able to read the full post below, please email us at support#nehcap.com [lwa][/s2If] [s2If current_user_can(access_s2member_level1)]
- NZD/USD recovers from YTD low even as RBNZ keeps monetary policy unchanged.
The pair currently trades last at 0.59623.
The previous day high was 0.5997 while the previous day low was 0.5947. The daily 38.2% Fib levels comes at 0.5966, expected to provide resistance. Similarly, the daily 61.8% fib level is at 0.5978, expected to provide resistance.
NZD/USD portrays a 20-pip rise on the Reserve Bank of New Zealand’s (RBNZ) monetary policy announcements early Wednesday. In doing so, the Kiwi pair prods the six-day downtrend while bouncing off the yearly low.
That said, the RBNZ keeps the benchmark interest rates unchanged at 5.5% but the quarterly Rate Statement appears hawkish and allows the Kiwi pair to portray a corrective bounce from the Year-To-Date (YTD) low.
Also read: RBNZ Minutes: Committee confident that with interest rates remaining at a restrictive level for some time
Apart from the RBNZ moves, the pessimism surrounding China and the upbeat US Treasury bond yields also become important catalysts for the NZD/USD traders as they exert downside pressure on the quote of late.
That said, the downbeat China data and the People’s Bank of China’s (PBoC) surprise rate cuts renew economic fears about the world’s second-largest economy and weighed on the Antipodeans. On Tuesday, the People’s Bank of China (PBOC), surprised markets by lowering the one-year Medium-term Lending Facility (MLF) rate to 2.50% from 2.65% previous and the Standing Lending Facility rates (SLFs), as well as by cutting the Reverse Repo Rate to 1.8% from 1.9% previously.
The same joined China’s downbeat July Retail Sales that rose 2.5% YoY vs. 4.8% expected and 3.1% previous, as well as the Industrial Production that came in at 3.7% YoY vs. 4.5% estimated and 4.4% prior, to flag the fears surrounding the Dragon Nation and weigh on the NZD/USD price.
It should be noted that the hawkish statements from Minneapolis Federal Reserve President Neel Kashkari joined the upbeat US Retail Sales growth for July, 0.7% MoM versus 0.4% expected, also add strength to the bearish bias about the NZD/USD pair, via firmer US Dollar.
On a different page, the Analysts at the global rating agency Fitch Ratings told CNBC on Tuesday said that the agency could downgrade several big lenders, including JPMorgan, as reported by Reuters, which in turn bolstered the risk aversion and pleased the Kiwi bears.
Amid these plays, the US Dollar Index (DXY) stays firmer poking the key resistance surrounding 103.30 at the monthly high whereas Wall Street closed in the red and the US 10-year Treasury bond yields seesaw around the yearly high. It should be noted that the S&P500 Futures remain lackluster by the press time.
Having witnessed the initial market reaction to the New Zealand central bank announcements, the NZD/USD pair traders will keep an eye on RBNZ Governor Adrian Orr’s Press Conference, scheduled for 03:00 AM GMT, for fresh impulse. Above all, headlines surrounding China’s economic conditions and the Federal Reserve (Fed) monetary policy meeting minutes will be crucial for clear directions of the Kiwi pair.
With a daily closing below May’s bottom of around 0.5985, the NZD/USD becomes vulnerable to drop toward the early October 2022 peak of around 0.5815.
Technical Levels: Supports and Resistances
NZDUSD currently trading at 0.5942 at the time of writing. Pair opened at 0.5951 and is trading with a change of -0.15% % .
| Overview | Overview.1 | |
|---|---|---|
| 0 | Today last price | 0.5942 |
| 1 | Today Daily Change | -0.0009 |
| 2 | Today Daily Change % | -0.15% |
| 3 | Today daily open | 0.5951 |
The pair remains strongly bearish on the daily time frame. It trades below the 20 SMA @ 0.612, 50 SMA 0.616, 100 SMA @ 0.6179 and 200 SMA @ 0.6233.
| Trends | Trends.1 | |
|---|---|---|
| 0 | Daily SMA20 | 0.6120 |
| 1 | Daily SMA50 | 0.6160 |
| 2 | Daily SMA100 | 0.6179 |
| 3 | Daily SMA200 | 0.6233 |
The previous day high was 0.5997 while the previous day low was 0.5947. The daily 38.2% Fib levels comes at 0.5966, expected to provide resistance. Similarly, the daily 61.8% fib level is at 0.5978, expected to provide resistance.
Note the levels of interest below:
- Pivot support is noted at 0.5933, 0.5915, 0.5883
- Pivot resistance is noted at 0.5983, 0.6015, 0.6033
| Levels | Levels.1 |
|---|---|
| Previous Daily High | 0.5997 |
| Previous Daily Low | 0.5947 |
| Previous Weekly High | 0.6118 |
| Previous Weekly Low | 0.5974 |
| Previous Monthly High | 0.6413 |
| Previous Monthly Low | 0.6120 |
| Daily Fibonacci 38.2% | 0.5966 |
| Daily Fibonacci 61.8% | 0.5978 |
| Daily Pivot Point S1 | 0.5933 |
| Daily Pivot Point S2 | 0.5915 |
| Daily Pivot Point S3 | 0.5883 |
| Daily Pivot Point R1 | 0.5983 |
| Daily Pivot Point R2 | 0.6015 |
| Daily Pivot Point R3 | 0.6033 |
[/s2If]
Download Nehcap EAWe have two EAs that are operational on our LIVE accounts.
- EA-FIX: Check out the details here. Download EA-FIX . EA-FIX is a non-grid HFT scalper.
- EA-GROWTH: High quality low dd EA using trend grids. Download EA_GROWTHJoin Our Telegram Group


