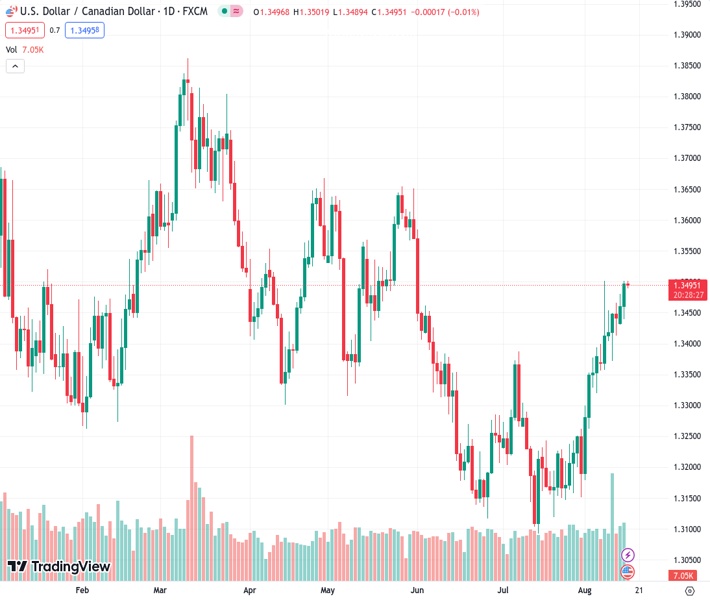
The US dollar to Canadian dollar exchange rate, currently at 1.34965, is gaining strength and becoming more active, staying below the 1.3500 level after positive data from the US.
…
This is a premium post.
[s2If !current_user_can(access_s2member_level4)]Please register for FREE REGISTER to read full post below containing analysis. In case of any error or you think you are not able to read the full post below, please email us at support#nehcap.com [lwa][/s2If] [s2If current_user_can(access_s2member_level1)]
- USD/CAD gains momentum below the 1.3500 mark following the upbeat US data.
The pair currently trades last at 1.34965.
The previous day high was 1.3502 while the previous day low was 1.3439. The daily 38.2% Fib levels comes at 1.3478, expected to provide support. Similarly, the daily 61.8% fib level is at 1.3463, expected to provide support.
The USD/CAD pair extends its upside just below the 1.3500 barrier during the early Asian session on Wednesday. The upbeat July US Retail Sales caused the market to discount a more aggressive wager by the Federal Reserve (Fed) and favour the US Dollar (USD). The major pair currently trades near 1.3493, down 0.03% for the day.
On Tuesday, the Canadian Consumer Price Index (CPI) rose 0.6% MoM, while the annualised figure increased to 3.3%, above the 3% expectation and the previous 2.8%. The Core CPI, which excludes volatile oil and food prices YoY for July, increased to 3.2%, compared to the 2.8% predicted from the previous reading of 2.8%.
The report indicated that inflation in Canada remains high, and it raised the prospect of another interest rate hike by the Bank of Canada (BoC) in its September policy meeting. It’s worth noting that the BoC raised its benchmark overnight rate to a 22-year high of 5.0% after a four-decade high of 8.1% in inflation. It was the tenth rate hike since March 2022. Meanwhile, a decline in oil prices undermines the Canadian Dollar since Canada is the largest oil exporter to the United States.
On the other hand, the US Census Bureau reported on Tuesday that US Retail Sales came in above expectations. The headline figure climbed by 0.7% MoM, higher than the 0.4% estimated. Sales excluding the automobile sector came in at 1%, versus the expected 0.4%. Finally, the NY Empire Manufacturing Index for August declined to -19 from -1.
Apart from the data, Minnesota’s Federal Reserve (Fed) President Neil Kashkari stated that he is pleased with the progress on inflation, but it is still too high. Kashkari, on the other hand, questioned whether the Fed had done enough or whether more needed to be done.
Looking ahead, market participants will keep an eye on the US Building Permits, Housing Starts, and Industrial Production due on Wednesday. The closely watched event this week will be FOMC Minutes on Thursday. The event will be critical for determining a clear movement for the USD/CAD pair.
Technical Levels: Supports and Resistances
USDCAD currently trading at 1.3493 at the time of writing. Pair opened at 1.3498 and is trading with a change of -0.04 % .
| Overview | Overview.1 | |
|---|---|---|
| 0 | Today last price | 1.3493 |
| 1 | Today Daily Change | -0.0005 |
| 2 | Today Daily Change % | -0.0400 |
| 3 | Today daily open | 1.3498 |
The pair remains strongly bullish on the daily timeframe. It trades above its 20 SMA @ 1.331, 50 SMA 1.3271, 100 SMA @ 1.3384 and 200 SMA @ 1.3451.
| Trends | Trends.1 | |
|---|---|---|
| 0 | Daily SMA20 | 1.3310 |
| 1 | Daily SMA50 | 1.3271 |
| 2 | Daily SMA100 | 1.3384 |
| 3 | Daily SMA200 | 1.3451 |
The previous day high was 1.3502 while the previous day low was 1.3439. The daily 38.2% Fib levels comes at 1.3478, expected to provide support. Similarly, the daily 61.8% fib level is at 1.3463, expected to provide support.
Note the levels of interest below:
- Pivot support is noted at 1.3457, 1.3417, 1.3395
- Pivot resistance is noted at 1.352, 1.3542, 1.3582
| Levels | Levels.1 |
|---|---|
| Previous Daily High | 1.3502 |
| Previous Daily Low | 1.3439 |
| Previous Weekly High | 1.3502 |
| Previous Weekly Low | 1.3356 |
| Previous Monthly High | 1.3387 |
| Previous Monthly Low | 1.3093 |
| Daily Fibonacci 38.2% | 1.3478 |
| Daily Fibonacci 61.8% | 1.3463 |
| Daily Pivot Point S1 | 1.3457 |
| Daily Pivot Point S2 | 1.3417 |
| Daily Pivot Point S3 | 1.3395 |
| Daily Pivot Point R1 | 1.3520 |
| Daily Pivot Point R2 | 1.3542 |
| Daily Pivot Point R3 | 1.3582 |
[/s2If]
Download Nehcap EAWe have two EAs that are operational on our LIVE accounts.
- EA-FIX: Check out the details here. Download EA-FIX . EA-FIX is a non-grid HFT scalper.
- EA-GROWTH: High quality low dd EA using trend grids. Download EA_GROWTHJoin Our Telegram Group


