The US Retail Sales data for EURUSD at a rate of 1.09037 is better than expected, as core sales have surged by 1%. This has a significant impact on the GDP consumer spending outlook.
…
This is a premium post.
[s2If !current_user_can(access_s2member_level4)]Please register for FREE REGISTER to read full post below containing analysis. In case of any error or you think you are not able to read the full post below, please email us at support#nehcap.com [lwa][/s2If] [s2If current_user_can(access_s2member_level1)]
- US Retail Sales outpace expectations, with core sales jumping 1%, influencing the GDP consumer spending outlook.
The pair currently trades last at 1.09037.
The previous day high was 1.096 while the previous day low was 1.0874. The daily 38.2% Fib levels comes at 1.0907, expected to provide resistance. Similarly, the daily 61.8% fib level is at 1.0928, expected to provide resistance.
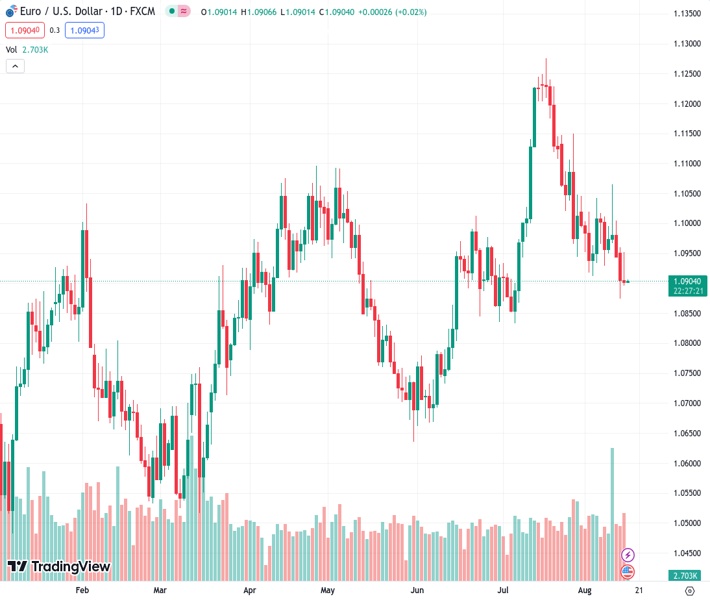
EUR/USD extended its losses on Tuesday for two straight days and clings above the 1.0900 figure after solid data from the United States (US) reignited worries of additional tightening by the Federal Reserve (Fed) amidst a resilient US economy. At the time of writing, the EUR/USD exchanges hands at 1.0903, gaining 0.02% as the Asian session begins.
The EUR/USD seesawed during the session after the US Department of Commerce revealed that Retail Sales in the US exceeded forecasts of 0.4% MoM, with July sales growing by 0.7%, while excluding Autos, also called core retail sales, jumped 1%, smashing estimates of 0.4%. Core Retail Sales correspond closely with the Gross Domestic Product (GDP) consumer spending component.
Initially, the data sent the EUR/USD sliding but options expiring at 10:00 AM NY cut, at around 1.0930-3 topping 1.1 billion and at 1.0940 2.3 billion, triggered a rally in the pair. Past the cut, the EUR/USD reversed its course, finishing the session near the day’s lows.
Following the data, some banks on Wall Street, like Goldman Sachs, revised their Q3 Gross Domestic Product (GDP) forecasts to a 2.2% annualized rate. The Atlanta’s Fed GDPNow model, which estimates GDP expectations, updated its model after Retail sales data showed GDP jumping to 5% from 4.1% foreseen on August 8.
Meanwhile, bets for a pause on hikes by the Federal Reserve (Fed) in September remain intact at 89% after the data, while for November, it stood above 30% chance.
Other data from the US Department of Labor showed that Import and Export Prices rose above estimates. At the same time, the New York Federal Reserve revealed its Manufacturing Index plunged to -19, exceeding projections of -1, after business conditions improved in July.
Minnesota’s Fed President Neil Kashkari crossed the wires, expressing that inflation is still too high, even though he feels good about its progress while noting uncertainty about whether the Fed has done enough or needs to do more. He added US central bank officials are surprised by the economy’s resilience.
The EUR/USD remains neutral to downward bias, with the pair continuing to print lower highs and lower lows, seen as a pivotal reason for defining a downtrend. On Tuesday, sellers stepped in, dragging the exchange rate below the 100-day Exponential Moving Average (EMA), as they eye a break below the current week’s low of 1.0874. A breach of the latter will expose the July 6 daily low of 1.0833, followed by the 1.0800 mark and the 200-day EMA at 1.0784. Contrarily, EUR/USD buyers must keep prices above 1.0900 if they want to challenge the daily EMAs as first resistance levels, with the 100-day EMA at 1.0930, the 50-day EMA at 1.0972 and the 20-day EMA at 1.0994.
Technical Levels: Supports and Resistances
EURUSD currently trading at 1.0904 at the time of writing. Pair opened at 1.0906 and is trading with a change of -0.02 % .
| Overview | Overview.1 | |
|---|---|---|
| 0 | Today last price | 1.0904 |
| 1 | Today Daily Change | -0.0002 |
| 2 | Today Daily Change % | -0.0200 |
| 3 | Today daily open | 1.0906 |
The pair is trading below its 20 Daily moving average @ 1.1026, below its 50 Daily moving average @ 1.0966 , below its 100 Daily moving average @ 1.093 and above its 200 Daily moving average @ 1.0777
| Trends | Trends.1 | |
|---|---|---|
| 0 | Daily SMA20 | 1.1026 |
| 1 | Daily SMA50 | 1.0966 |
| 2 | Daily SMA100 | 1.0930 |
| 3 | Daily SMA200 | 1.0777 |
The previous day high was 1.096 while the previous day low was 1.0874. The daily 38.2% Fib levels comes at 1.0907, expected to provide resistance. Similarly, the daily 61.8% fib level is at 1.0928, expected to provide resistance.
Note the levels of interest below:
- Pivot support is noted at 1.0867, 1.0828, 1.0781
- Pivot resistance is noted at 1.0952, 1.0999, 1.1038
| Levels | Levels.1 |
|---|---|
| Previous Daily High | 1.0960 |
| Previous Daily Low | 1.0874 |
| Previous Weekly High | 1.1065 |
| Previous Weekly Low | 1.0929 |
| Previous Monthly High | 1.1276 |
| Previous Monthly Low | 1.0834 |
| Daily Fibonacci 38.2% | 1.0907 |
| Daily Fibonacci 61.8% | 1.0928 |
| Daily Pivot Point S1 | 1.0867 |
| Daily Pivot Point S2 | 1.0828 |
| Daily Pivot Point S3 | 1.0781 |
| Daily Pivot Point R1 | 1.0952 |
| Daily Pivot Point R2 | 1.0999 |
| Daily Pivot Point R3 | 1.1038 |
[/s2If]
Download Nehcap EAWe have two EAs that are operational on our LIVE accounts.
- EA-FIX: Check out the details here. Download EA-FIX . EA-FIX is a non-grid HFT scalper.
- EA-GROWTH: High quality low dd EA using trend grids. Download EA_GROWTHJoin Our Telegram Group


