Unemployment in the UK drops to 4.2% as wages, not including bonuses, experience their fastest growth rate since 2001.
…
This is a premium post.
[s2If !current_user_can(access_s2member_level4)]Please register for FREE REGISTER to read full post below containing analysis. In case of any error or you think you are not able to read the full post below, please email us at support#nehcap.com [lwa][/s2If] [s2If current_user_can(access_s2member_level1)]
- UK wages excluding bonuses soar to the highest growth rate since 2001, pushing unemployment to 4.2%.
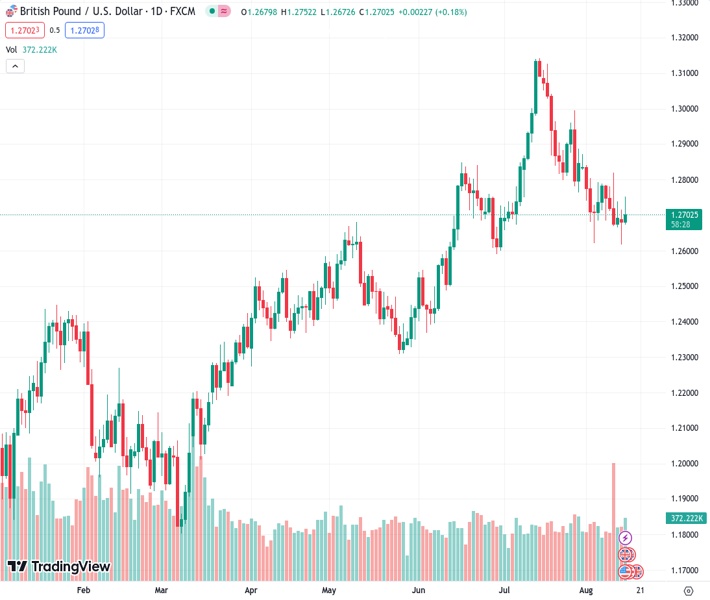
The pair currently trades last at 1.27020.
The previous day high was 1.2715 while the previous day low was 1.2617. The daily 38.2% Fib levels comes at 1.2654, expected to provide support. Similarly, the daily 61.8% fib level is at 1.2677, expected to provide support.
GBP/USD rises following Monday’s session, which portrayed a ‘hammer’ formation, suggesting that further upside is expected. Jobs data in the UK overshadowed upbeat economic data from the United States (US), as wages grew above estimates, adding to the Bank of England’s (BoE) inflation pressures. Hence, the GBP/USD trades at 1.2705, above its opening price by 0.21%.
The Office for National Statistics (ONS) revealed that wages excluding bonuses rose 7.8% YoY in the three months to June, which according to Reuters, represents “the highest annual growth rate since comparable records began in 2001.” The same report highlighted the Unemployment Rate climbed to 4.2% from 4%.
In the meantime, traders brace for Wednesday’s inflation report. Any upside surprise could increase BoE’s chances of raising rates. Money market traders are fully pricing in a 25 basis point hike at its September meeting, with around a 12% chance they lift rates by a larger size of 50 basis points.
On the US front, US Retail Sales in the US exceeded estimates of 0.4% MoM, with July sales growing by 0.7%, while excluding Autos, also called core retail sales, jumped 1%, smashing forecasts of 0.4%. Core Retail Sales correspond most closely with the Gross Domestic Product (GDP) consumer spending component.
The report triggered a revision of US growth prospects, with Goldman Sachs raising Q3’s Gross Domestic Product (GDP) to a 2.2% annualized rate. Today’s data was computed by Atlanta’s Fed GDPNow model, which forecasts GDP expectations, jumping to 5% from 4.1% foreseen on August 8.
Meanwhile, bets for a pause on hikes by the Federal Reserve (Fed) in September remain intact at 89% after the data, while for November, it stood above 30% chance.
Other data from the US Department of Labor showed that Import and Export Prices rose above estimates. At the same time, the New York Federal Reserve revealed its Manufacturing Index plunged to -19, exceeding projections of -1, after business conditions improved in July.
Minnesota’s Fed President Neil Kashkari crossed the wires, expressing that inflation is still too high, even though he feels good about its progress while noting uncertainty about whether the Fed has done enough or needs to do more. He added US central bank officials are surprised by the economy’s resilience.
Given the backdrop, the GBP/USD could test the 1.2800 figure if UK’s inflation becomes higher than estimated. On the other hand, expect GBP/USD weakness if prices continue to cool down, as expected.
Although the GBP/USD remains in consolidation, it acquired a slight bullish bias, but its advancement is being capped by the 50 and 20-day Exponential Moving Average (EMA), each at 1.2734 and 1.2756, respectively. A daily close above those levels could impulse the GBP/USD exchange rate toward the 1.2800 figure, followed by 1.2900 and the July 27 pivot high at 1.2995. Conversely, if GBP/USD fails to print a daily close above 1.2700, expect the pair to dive towards the current week’s low of 1.2616 before challenging 1.2600.
Technical Levels: Supports and Resistances
GBPUSD currently trading at 1.2699 at the time of writing. Pair opened at 1.2684 and is trading with a change of 0.12 % .
| Overview | Overview.1 | |
|---|---|---|
| 0 | Today last price | 1.2699 |
| 1 | Today Daily Change | 0.0015 |
| 2 | Today Daily Change % | 0.1200 |
| 3 | Today daily open | 1.2684 |
The pair is trading below its 20 Daily moving average @ 1.2805, below its 50 Daily moving average @ 1.2769 , above its 100 Daily moving average @ 1.2613 and above its 200 Daily moving average @ 1.2357
| Trends | Trends.1 | |
|---|---|---|
| 0 | Daily SMA20 | 1.2805 |
| 1 | Daily SMA50 | 1.2769 |
| 2 | Daily SMA100 | 1.2613 |
| 3 | Daily SMA200 | 1.2357 |
The previous day high was 1.2715 while the previous day low was 1.2617. The daily 38.2% Fib levels comes at 1.2654, expected to provide support. Similarly, the daily 61.8% fib level is at 1.2677, expected to provide support.
Note the levels of interest below:
- Pivot support is noted at 1.2629, 1.2573, 1.253
- Pivot resistance is noted at 1.2727, 1.277, 1.2825
| Levels | Levels.1 |
|---|---|
| Previous Daily High | 1.2715 |
| Previous Daily Low | 1.2617 |
| Previous Weekly High | 1.2819 |
| Previous Weekly Low | 1.2666 |
| Previous Monthly High | 1.3142 |
| Previous Monthly Low | 1.2659 |
| Daily Fibonacci 38.2% | 1.2654 |
| Daily Fibonacci 61.8% | 1.2677 |
| Daily Pivot Point S1 | 1.2629 |
| Daily Pivot Point S2 | 1.2573 |
| Daily Pivot Point S3 | 1.2530 |
| Daily Pivot Point R1 | 1.2727 |
| Daily Pivot Point R2 | 1.2770 |
| Daily Pivot Point R3 | 1.2825 |
[/s2If]
Download Nehcap EAWe have two EAs that are operational on our LIVE accounts.
- EA-FIX: Check out the details here. Download EA-FIX . EA-FIX is a non-grid HFT scalper.
- EA-GROWTH: High quality low dd EA using trend grids. Download EA_GROWTHJoin Our Telegram Group


