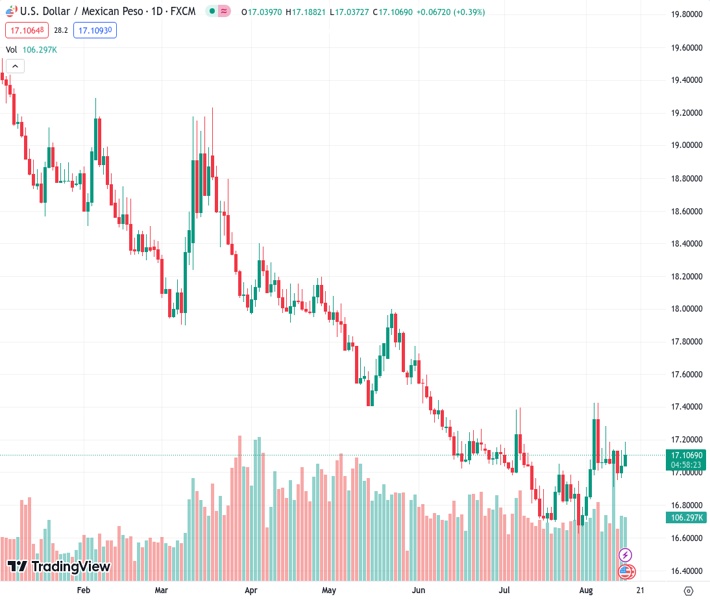
The USDMXN is currently at a rate of 17.1131. Retail sales in the US for July have exceeded expectations and have been boosted by Amazon’s Prime Day, resulting in a 1% increase in core sales.
…
This is a premium post.
[s2If !current_user_can(access_s2member_level4)]Please register for FREE REGISTER to read full post below containing analysis. In case of any error or you think you are not able to read the full post below, please email us at support#nehcap.com [lwa][/s2If] [s2If current_user_can(access_s2member_level1)]
- US Retail Sales for July surpass expectations, buoyed by Amazon’s Prime Day, pushing core sales up by 1%.
The pair currently trades last at 17.1131.
The previous day high was 17.1371 while the previous day low was 16.9663. The daily 38.2% Fib levels comes at 17.0718, expected to provide support. Similarly, the daily 61.8% fib level is at 17.0315, expected to provide support.
USD/MXN climbs in the North American session by more than 0.40% as the Greenback stages a recovery, spurred by solid economic data from the United States (US) igniting rate jitters. Hence, the USD/MXN advanced to new weekly highs, exchanging hands at 17.1181.
Market sentiment remains downbeat, as reflected by Wall Street printing losses. Retail Sales in the US exceeded estimates of 0.4% on a monthly basis, with July sales expanding by 0.7%, propelled by Amazon’s Prime Day. Excluding Autos, also called core retail sales, jumped 1%, crushing estimates of 0.4%. Core Retail Saeles correspond most closely with the Gross Domestic Product (GDP) consumer spending component.
Other data from the US Department of Labor showed that Import and Export Prices rose above estimates. At the same time, the New York Federal Reserve revealed its Manufacturing Index plunged to -19, exceeding projections of -1, after business conditions improved in July.
In the meantime, US Treasury bond yields paired their earlier gains, with the US 10-year Treasury note yield standing at 4.187% after touching a high of 4.274%, while the US Dollar reversed some of its earlier gains. The US Dollar Index (DXY), which tracks the buck’s performance against a basket of rivals,
In the meantime, Minnesota’s Fed President Neil Kashkari is crossing the wires, expressing he feels that inflation is still too high, despite feeling good about the progress while noting uncertainty about whether the Fed has done enough or needs to do more. He added US central bank officials are surprised by the economy’s resilience.
Even though market participants remain skeptical about another rate hike by the Fed, expectations stay at 32.2% for November’s monetary policy meeting, higher than a week ago’s 28% chances.
Given the backdrop, the USD/MXN might remain above the 17.0000 price level; even though the Mexican Peso (MXN) has been under pressure, the interest rate differential benefits the emerging market currency. That would put a lid on USD/MXN’s rally, and if the pair is to edge higher, it could do it steadily unless risk-aversion triggers outflows from riskier assets.
As of writing, the USD/MXN spot price is above the 20 and 50-day Exponential Moving Averages (EMAs), each at 17.0171 and 17.1234, which could pave the way for further upside. Even though it looks like the exotic currency pair achieved a bottom, USD/MXN buyers must reclaim the May 17 daily low-turned resistance at 17.4038, which could pave the way to test the 100-day EMA at 17.4605 before challenging 17.5000. Otherwise, further downside is expected below the psychological 17.0000 level, with the year-to-date (YTD) low lingering around 16.6238.
Technical Levels: Supports and Resistances
USDMXN currently trading at 17.1278 at the time of writing. Pair opened at 17.0528 and is trading with a change of 0.44 % .
| Overview | Overview.1 | |
|---|---|---|
| 0 | Today last price | 17.1278 |
| 1 | Today Daily Change | 0.0750 |
| 2 | Today Daily Change % | 0.4400 |
| 3 | Today daily open | 17.0528 |
The pair is trading above its 20 Daily moving average @ 16.9507, above its 50 Daily moving average @ 17.0476 , below its 100 Daily moving average @ 17.4705 and below its 200 Daily moving average @ 18.2382
| Trends | Trends.1 | |
|---|---|---|
| 0 | Daily SMA20 | 16.9507 |
| 1 | Daily SMA50 | 17.0476 |
| 2 | Daily SMA100 | 17.4705 |
| 3 | Daily SMA200 | 18.2382 |
The previous day high was 17.1371 while the previous day low was 16.9663. The daily 38.2% Fib levels comes at 17.0718, expected to provide support. Similarly, the daily 61.8% fib level is at 17.0315, expected to provide support.
Note the levels of interest below:
- Pivot support is noted at 16.9671, 16.8813, 16.7963
- Pivot resistance is noted at 17.1378, 17.2228, 17.3086
| Levels | Levels.1 |
|---|---|
| Previous Daily High | 17.1371 |
| Previous Daily Low | 16.9663 |
| Previous Weekly High | 17.2852 |
| Previous Weekly Low | 16.9101 |
| Previous Monthly High | 17.3957 |
| Previous Monthly Low | 16.6258 |
| Daily Fibonacci 38.2% | 17.0718 |
| Daily Fibonacci 61.8% | 17.0315 |
| Daily Pivot Point S1 | 16.9671 |
| Daily Pivot Point S2 | 16.8813 |
| Daily Pivot Point S3 | 16.7963 |
| Daily Pivot Point R1 | 17.1378 |
| Daily Pivot Point R2 | 17.2228 |
| Daily Pivot Point R3 | 17.3086 |
[/s2If]
Download Nehcap EAWe have two EAs that are operational on our LIVE accounts.
- EA-FIX: Check out the details here. Download EA-FIX . EA-FIX is a non-grid HFT scalper.
- EA-GROWTH: High quality low dd EA using trend grids. Download EA_GROWTHJoin Our Telegram Group


