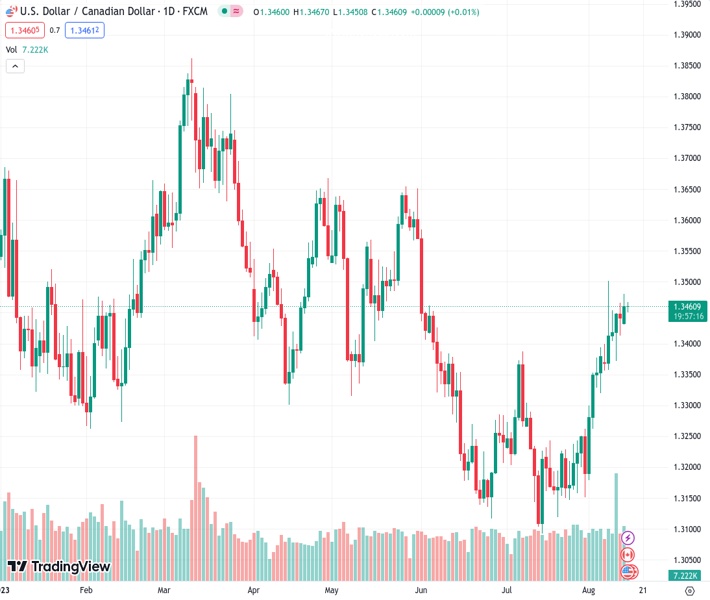
The US dollar to Canadian dollar exchange rate, currently at 1.34598, is showing increasing strength near the level of 1.3460 due to growing demand for the US dollar.
…
This is a premium post.
[s2If !current_user_can(access_s2member_level4)]Please register for FREE REGISTER to read full post below containing analysis. In case of any error or you think you are not able to read the full post below, please email us at support#nehcap.com [lwa][/s2If] [s2If current_user_can(access_s2member_level1)]
- USD/CAD gains momentum around 1.3460 amid USD demand.
The pair currently trades last at 1.34598.
The previous day high was 1.348 while the previous day low was 1.3437. The daily 38.2% Fib levels comes at 1.3463, expected to provide resistance. Similarly, the daily 61.8% fib level is at 1.3453, expected to provide support.
The USD/CAD pair edges higher to 1.3460 in the early Asian session on Tuesday. The main driver of the USD’s strength is a rise in US yields as the 10-year yield climbs above 4.20%. Meanwhile, the easing in oil price undermines the Loonie against the US Dollar. The key events on Tuesday might trigger volatility across the market.
Market participants anticipate that the Federal Reserve (Fed) will keep the interest rate unchanged in its September meeting as US inflation remains moderate and in line with the central bank’s target of 2%. However, the odds for an additional rate hike of 25 basis points (bps) increased to almost 40% in its November meeting. Last week, UoM 5-year Consumer Inflation Expectations declined to 2.9% for August versus 3.0% estimated and prior. While, UoM Consumer Confidence Index for July fell to 71.2 from 71.6, better than expected, and the US Producer Price Index (PPI) for final demand YoY rose 0.8% in July from 0.1% in June,
On the Canadian Dollar front, a decline in oil prices undermines the Canadian Dollar since Canada is the largest oil exporter to the United States. Last week, Canadian Building Permits came in at 6.1% MoM in July, better than market expectations of a 3.5% drop. Additionally, Canada’s trade deficit widened to C$3.73 billion in June, the highest level in nearly three years. Exports fell 2.2%, and Imports fell 0.5%. Market players await the annual Canadian Consumer Price Index for July. The upbeat data might cap the downside of Loonie and act as a headwind for the USD/CAD pair.
Looking ahead, market participants will keep an eye on the Canadian Consumer Price Index (CPI) YoY for July on Tuesday. The annual CPI is expected to rise from 2.8% to 3.0%, while the monthly CPI is seen at 0.3% versus 0.1% prior. Across the pond, the US Retail Sales and FOMC minutes will be due on Tuesday and Thursday, respectively. Investors will also take cues from the Fed officials’s comments for the Jackson Hole Symposium. The data will be critical for determining a clear movement for the USD/CAD pair.
Technical Levels: Supports and Resistances
USDCAD currently trading at 1.3462 at the time of writing. Pair opened at 1.3461 and is trading with a change of 0.01 % .
| Overview | Overview.1 | |
|---|---|---|
| 0 | Today last price | 1.3462 |
| 1 | Today Daily Change | 0.0001 |
| 2 | Today Daily Change % | 0.0100 |
| 3 | Today daily open | 1.3461 |
The pair remains strongly bullish on the daily timeframe. It trades above its 20 SMA @ 1.3293, 50 SMA 1.3269, 100 SMA @ 1.3386 and 200 SMA @ 1.345.
| Trends | Trends.1 | |
|---|---|---|
| 0 | Daily SMA20 | 1.3293 |
| 1 | Daily SMA50 | 1.3269 |
| 2 | Daily SMA100 | 1.3386 |
| 3 | Daily SMA200 | 1.3450 |
The previous day high was 1.348 while the previous day low was 1.3437. The daily 38.2% Fib levels comes at 1.3463, expected to provide resistance. Similarly, the daily 61.8% fib level is at 1.3453, expected to provide support.
Note the levels of interest below:
- Pivot support is noted at 1.3438, 1.3416, 1.3395
- Pivot resistance is noted at 1.3482, 1.3502, 1.3525
| Levels | Levels.1 |
|---|---|
| Previous Daily High | 1.3480 |
| Previous Daily Low | 1.3437 |
| Previous Weekly High | 1.3502 |
| Previous Weekly Low | 1.3356 |
| Previous Monthly High | 1.3387 |
| Previous Monthly Low | 1.3093 |
| Daily Fibonacci 38.2% | 1.3463 |
| Daily Fibonacci 61.8% | 1.3453 |
| Daily Pivot Point S1 | 1.3438 |
| Daily Pivot Point S2 | 1.3416 |
| Daily Pivot Point S3 | 1.3395 |
| Daily Pivot Point R1 | 1.3482 |
| Daily Pivot Point R2 | 1.3502 |
| Daily Pivot Point R3 | 1.3525 |
[/s2If]
Download Nehcap EAWe have two EAs that are operational on our LIVE accounts.
- EA-FIX: Check out the details here. Download EA-FIX . EA-FIX is a non-grid HFT scalper.
- EA-GROWTH: High quality low dd EA using trend grids. Download EA_GROWTHJoin Our Telegram Group


