The price of silver, represented by #XAGUSD, is facing difficulty in continuing its decline below the 200-day moving average. The ascending trend line that has been in place since early March has resulted in sellers being activated. According to the viewpoint of @nehcap, it is anticipated that there will not be a significant decrease in value.
…
This is a premium post.
[s2If !current_user_can(access_s2member_level4)]Please register for FREE REGISTER to read full post below containing analysis. In case of any error or you think you are not able to read the full post below, please email us at support#nehcap.com [lwa][/s2If] [s2If current_user_can(access_s2member_level1)]
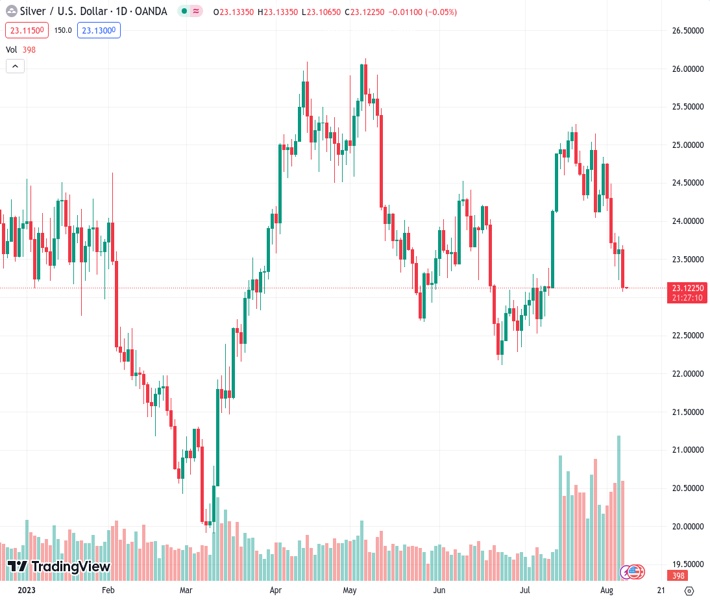
- Silver Price struggles to extend 200-DMA breakdown as ascending trend line from early March prod sellers.
The pair currently trades last at 23.121.
The previous day high was 23.8 while the previous day low was 23.23. The daily 38.2% Fib levels comes at 23.58, expected to provide resistance. Similarly, the daily 61.8% fib level is at 23.44, expected to provide resistance.
Silver Price (XAG/USD) remains on the back foot at the lowest level in a month, making rounds to $23.10-05 during the early Asian session on Tuesday.
That said, the quote’s latest inaction could be linked to the XAG/USD’s inability to extend the 200-DMA breakdown as a five-month-old support line challenges the bears. Also providing headwinds to the Silver Price are the below 50.0 conditions of the RSI (14) line that suggests bottom-picking.
However, the bearish MACD signals join the key DMA breakdown to keep the Silver sellers hopeful.
Hence, the commodity’s fresh downside may wait for a clear break of the stated support line, close to $23.00 by the press time.
Following that, the November 2022 peak of around $22.25 and June 2023 bottom surrounding $22.10 may prod the XAG/USD sellers before directing them to an 11-month-old rising support line, close to $21.75 by the press time.
Alternatively, recovery moves must provide a daily closing beyond the 200-DMA hurdle of $23.20.
Even so, the $24.00 round figure, June’s peak of around $24.55 and a downward-sloping resistance line from May 05, near $25.05 by the press time, will challenge the XAG/USD.
Trend: Limited downside expected
Technical Levels: Supports and Resistances
XAGUSD currently trading at 23.11 at the time of writing. Pair opened at 23.63 and is trading with a change of -2.20% % .
| Overview | Overview.1 | |
|---|---|---|
| 0 | Today last price | 23.11 |
| 1 | Today Daily Change | -0.52 |
| 2 | Today Daily Change % | -2.20% |
| 3 | Today daily open | 23.63 |
The pair remains strongly bearish on the daily time frame. It trades below the 20 SMA @ 24.35, 50 SMA 23.73, 100 SMA @ 24.05 and 200 SMA @ 23.17.
| Trends | Trends.1 | |
|---|---|---|
| 0 | Daily SMA20 | 24.35 |
| 1 | Daily SMA50 | 23.73 |
| 2 | Daily SMA100 | 24.05 |
| 3 | Daily SMA200 | 23.17 |
The previous day high was 23.8 while the previous day low was 23.23. The daily 38.2% Fib levels comes at 23.58, expected to provide resistance. Similarly, the daily 61.8% fib level is at 23.44, expected to provide resistance.
Note the levels of interest below:
- Pivot support is noted at 23.3, 22.98, 22.73
- Pivot resistance is noted at 23.87, 24.12, 24.44
| Levels | Levels.1 |
|---|---|
| Previous Daily High | 23.80 |
| Previous Daily Low | 23.23 |
| Previous Weekly High | 24.84 |
| Previous Weekly Low | 23.23 |
| Previous Monthly High | 25.27 |
| Previous Monthly Low | 22.52 |
| Daily Fibonacci 38.2% | 23.58 |
| Daily Fibonacci 61.8% | 23.44 |
| Daily Pivot Point S1 | 23.30 |
| Daily Pivot Point S2 | 22.98 |
| Daily Pivot Point S3 | 22.73 |
| Daily Pivot Point R1 | 23.87 |
| Daily Pivot Point R2 | 24.12 |
| Daily Pivot Point R3 | 24.44 |
[/s2If]
Download Nehcap EAWe have two EAs that are operational on our LIVE accounts.
- EA-FIX: Check out the details here. Download EA-FIX . EA-FIX is a non-grid HFT scalper.
- EA-GROWTH: High quality low dd EA using trend grids. Download EA_GROWTHJoin Our Telegram Group


