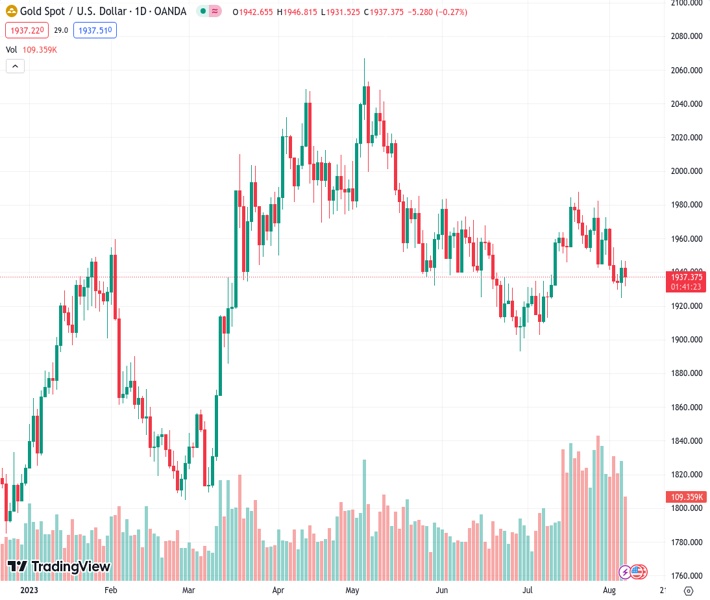
The price of gold in the XAUUSD pair reached its highest point of $1,945 for the day before stabilizing at $1,935.
…
This is a premium post.
[s2If !current_user_can(access_s2member_level4)]Please register for FREE REGISTER to read full post below containing analysis. In case of any error or you think you are not able to read the full post below, please email us at support#nehcap.com [lwa][/s2If] [s2If current_user_can(access_s2member_level1)]
- XAU/USD peaked at a daily high of $1,945 and then settled at $1,935.
The pair currently trades last at 1937.34.
The previous day high was 1946.9 while the previous day low was 1925.72. The daily 38.2% Fib levels comes at 1938.81, expected to provide resistance. Similarly, the daily 61.8% fib level is at 1933.81, expected to provide support.
At the start of the week, Gold prices slightly decreased as the recovery of the USD limits the upside potential. Markets are cautious ahead of critical inflation data on Thursday and continue to digest Nonfarm Payrolls (NFP) figures from Friday.
After NFPs revealed that job creation cooled down in July in the US, the USD faced severe selling pressure, and the DXY fell below 102.00. On Monday, the index recovered towards 102.10, as the Greenback traded strong against most of its rivals. Attention now turns to Thursday, when the US will report July’s inflation figures, where the Headline Consumer Price Index (CPI) index is expected to accelerate to 3.3% YoY and the Core CPI is seen falling to 4.7% in the same month.
As for now, the CME FedWatch tool suggests that investors discount higher odds of the Federal Reserve (Fed) not hiking in the rest of 2023. Still, inflation data this week will likely impact those bets.
Meanwhile, the US bond yields, which could be seen as the opportunity cost of holding the non-yielding yellow metal, are edging higher. The 10-year bond yield led the way and increased more than 1% in the session to the 4.08% level.
The technical analysis of the daily chart points to a neutral to a bearish outlook for XAU/USD, indicating the potential for further bearish movement. The Relative Strength Index (RSI) exhibits a negative slope below the 50 threshold, while the Moving Average Convergence (MACD) histogram lays out rising red bars. Plus, the metal is below the 20 and 100-day Simple Moving Averages (SMAs) but above the 200-day SMA, indicating that the bulls aren’t done yet and that the outlook is still positive for the short term.
Support levels: $1,930,$1,915, $1,900.
Resistance levels: $1,955 (20-day SMA), $1,970 (100-day SMA), $1,990.
Technical Levels: Supports and Resistances
XAUUSD currently trading at 1936.65 at the time of writing. Pair opened at 1942.88 and is trading with a change of -0.32 % .
| Overview | Overview.1 | |
|---|---|---|
| 0 | Today last price | 1936.65 |
| 1 | Today Daily Change | -6.23 |
| 2 | Today Daily Change % | -0.32 |
| 3 | Today daily open | 1942.88 |
The pair is trading below its 20 Daily moving average @ 1954.54, below its 50 Daily moving average @ 1945.17 , below its 100 Daily moving average @ 1969.09 and above its 200 Daily moving average @ 1894.9
| Trends | Trends.1 | |
|---|---|---|
| 0 | Daily SMA20 | 1954.54 |
| 1 | Daily SMA50 | 1945.17 |
| 2 | Daily SMA100 | 1969.09 |
| 3 | Daily SMA200 | 1894.90 |
The previous day high was 1946.9 while the previous day low was 1925.72. The daily 38.2% Fib levels comes at 1938.81, expected to provide resistance. Similarly, the daily 61.8% fib level is at 1933.81, expected to provide support.
Note the levels of interest below:
- Pivot support is noted at 1930.1, 1917.32, 1908.92
- Pivot resistance is noted at 1951.28, 1959.68, 1972.46
| Levels | Levels.1 |
|---|---|
| Previous Daily High | 1946.90 |
| Previous Daily Low | 1925.72 |
| Previous Weekly High | 1972.45 |
| Previous Weekly Low | 1925.72 |
| Previous Monthly High | 1987.54 |
| Previous Monthly Low | 1902.77 |
| Daily Fibonacci 38.2% | 1938.81 |
| Daily Fibonacci 61.8% | 1933.81 |
| Daily Pivot Point S1 | 1930.10 |
| Daily Pivot Point S2 | 1917.32 |
| Daily Pivot Point S3 | 1908.92 |
| Daily Pivot Point R1 | 1951.28 |
| Daily Pivot Point R2 | 1959.68 |
| Daily Pivot Point R3 | 1972.46 |
[/s2If]
Download Nehcap EAWe have two EAs that are operational on our LIVE accounts.
- EA-FIX: Check out the details here. Download EA-FIX . EA-FIX is a non-grid HFT scalper.
- EA-GROWTH: High quality low dd EA using trend grids. Download EA_GROWTHJoin Our Telegram Group


