On Monday, silver faced new selling pressure and appears susceptible to experiencing further decline.
…
This is a premium post.
[s2If !current_user_can(access_s2member_level4)]Please register for FREE REGISTER to read full post below containing analysis. In case of any error or you think you are not able to read the full post below, please email us at support#nehcap.com [lwa][/s2If] [s2If current_user_can(access_s2member_level1)]
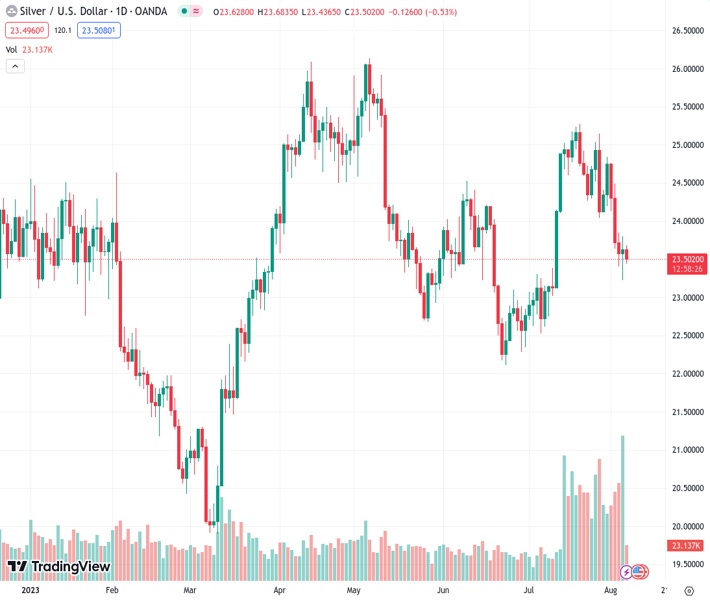
- Silver comes under fresh selling pressure on Monday and seems vulnerable to sliding further.
The pair currently trades last at 23.494.
The previous day high was 23.8 while the previous day low was 23.23. The daily 38.2% Fib levels comes at 23.58, expected to provide resistance. Similarly, the daily 61.8% fib level is at 23.44, expected to provide support.
Silver struggles to capitalize on Friday’s goodish rebound from the $23.20 area, or its lowest level since July 12 and attracts fresh sellers on the first day of a new week. The white metal maintains its offered tone through the early European session and is currently trading near the lower end of the daily range, around mid-$23.00s.
From a technical perspective, the recent pullback from the $25.25 area showed resilience below the 61.8% Fibonacci retracement level of the June-July rally and stalled near ascending trend-line support extending from a multi-month low touched in June. The subsequent move-up warrants some caution for bearish traders. That said, the lack of follow-through buying and a failure near the 50% Fibo. level, along with negative oscillators on the daily chart, suggest that the path of least resistance for the XAG/USD is to the downside.
However, it will still be prudent to wait for some follow-through selling below the ascending trend-line support, currently near the $23.20 region, which nears the very important 200-day Simple Moving Average (SMA), before placing fresh bearish bets. The XAG/USD might then turn vulnerable to weaken further below the $23.00 mark, towards retesting the multi-month low, around the $22.15-$22.10 area touched in June. This is closely followed by the $22.00 mark, which if broken decisively will set the stage for deeper near-term losses.
On the flip side, the 50% Fibo. level, around the $23.70 area, now seems to act as an immediate hurdle. Any subsequent move up is likely to attract fresh sellers and remain capped near the $24.00-$24.10 confluence support breakpoint, turned resistance. The said area comprises the 100-day SMA and the 38.2% Fibo. level, which should act as a pivotal point. A sustained strength beyond could lift the XAG/USD back towards the 23.6% Fibo. level, around the $24.45-$24.50 supply zone, en route to the $24.75 hurdle and the $25.00 psychological mark.
Technical Levels: Supports and Resistances
XAGUSD currently trading at 23.5 at the time of writing. Pair opened at 23.63 and is trading with a change of -0.55 % .
| Overview | Overview.1 | |
|---|---|---|
| 0 | Today last price | 23.50 |
| 1 | Today Daily Change | -0.13 |
| 2 | Today Daily Change % | -0.55 |
| 3 | Today daily open | 23.63 |
The pair is trading below its 20 Daily moving average @ 24.35, below its 50 Daily moving average @ 23.73 , below its 100 Daily moving average @ 24.05 and above its 200 Daily moving average @ 23.17
| Trends | Trends.1 | |
|---|---|---|
| 0 | Daily SMA20 | 24.35 |
| 1 | Daily SMA50 | 23.73 |
| 2 | Daily SMA100 | 24.05 |
| 3 | Daily SMA200 | 23.17 |
The previous day high was 23.8 while the previous day low was 23.23. The daily 38.2% Fib levels comes at 23.58, expected to provide resistance. Similarly, the daily 61.8% fib level is at 23.44, expected to provide support.
Note the levels of interest below:
- Pivot support is noted at 23.3, 22.98, 22.73
- Pivot resistance is noted at 23.87, 24.12, 24.44
| Levels | Levels.1 |
|---|---|
| Previous Daily High | 23.80 |
| Previous Daily Low | 23.23 |
| Previous Weekly High | 24.84 |
| Previous Weekly Low | 23.23 |
| Previous Monthly High | 25.27 |
| Previous Monthly Low | 22.52 |
| Daily Fibonacci 38.2% | 23.58 |
| Daily Fibonacci 61.8% | 23.44 |
| Daily Pivot Point S1 | 23.30 |
| Daily Pivot Point S2 | 22.98 |
| Daily Pivot Point S3 | 22.73 |
| Daily Pivot Point R1 | 23.87 |
| Daily Pivot Point R2 | 24.12 |
| Daily Pivot Point R3 | 24.44 |
[/s2If]
Download Nehcap EAWe have two EAs that are operational on our LIVE accounts.
- EA-FIX: Check out the details here. Download EA-FIX . EA-FIX is a non-grid HFT scalper.
- EA-GROWTH: High quality low dd EA using trend grids. Download EA_GROWTHJoin Our Telegram Group


