Canada experienced a slight decrease in employment during July, with a decline of 6,400 jobs.
…
This is a premium post.
[s2If !current_user_can(access_s2member_level4)]Please register for FREE REGISTER to read full post below containing analysis. In case of any error or you think you are not able to read the full post below, please email us at support#nehcap.com [lwa][/s2If] [s2If current_user_can(access_s2member_level1)]
- In Canada, jobs declined modestly in July by 6,400.
The pair currently trades last at 1.33590.
The previous day high was 1.3378 while the previous day low was 1.3329. The daily 38.2% Fib levels comes at 1.3359, expected to provide resistance. Similarly, the daily 61.8% fib level is at 1.3348, expected to provide support.
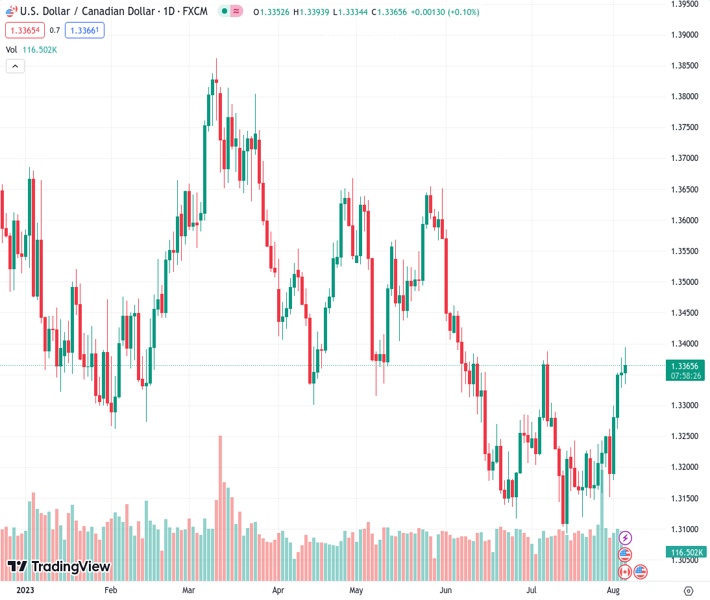
The USD/CAD initially dropped and then experienced a significant increase, reaching its highest level since early June, just below 1.3400. This movement in the currency pair was driven by employment data from both Canada and the US. As of the current writing, the pair is hovering around 1.3360, below the level it had before the release of the reports.
In Canada, the economy lost 6,400 jobs in July, against expectations of a 21,100 increase. The Unemployment rate rose to 5.5%. This is the first time since COVID that the unemployment rate has increased for three consecutive months. These numbers triggered a decline in the Canadian Dollar across the board.
The fact that the USD/CAD is hovering around the same level is attributed to the US jobs report, which also came in below market estimates and led to a decline in the value of the US Dollar. The Loonie is falling sharply versus NZD and AUD.
The US economy added 187,000 jobs in July, falling short of the expected 200,000. On a positive note, the Unemployment Rate fell from 3.6% to 3.5%. Average Hourly Earnings rose by 4.4% compared to a year ago, surpassing the market consensus of 4.2%.
US Treasury yields initially spiked but then reversed their course, weighing on the US Dollar. The DXY is down 0.30% for the day, trading below 102.20.
Technical Levels: Supports and Resistances
USDCAD currently trading at 1.3375 at the time of writing. Pair opened at 1.3353 and is trading with a change of 0.16 % .
| Overview | Overview.1 | |
|---|---|---|
| 0 | Today last price | 1.3375 |
| 1 | Today Daily Change | 0.0022 |
| 2 | Today Daily Change % | 0.1600 |
| 3 | Today daily open | 1.3353 |
The pair is trading above its 20 Daily moving average @ 1.3221, above its 50 Daily moving average @ 1.3284 , below its 100 Daily moving average @ 1.3406 and below its 200 Daily moving average @ 1.3457
| Trends | Trends.1 | |
|---|---|---|
| 0 | Daily SMA20 | 1.3221 |
| 1 | Daily SMA50 | 1.3284 |
| 2 | Daily SMA100 | 1.3406 |
| 3 | Daily SMA200 | 1.3457 |
The previous day high was 1.3378 while the previous day low was 1.3329. The daily 38.2% Fib levels comes at 1.3359, expected to provide resistance. Similarly, the daily 61.8% fib level is at 1.3348, expected to provide support.
Note the levels of interest below:
- Pivot support is noted at 1.3329, 1.3304, 1.328
- Pivot resistance is noted at 1.3378, 1.3403, 1.3427
| Levels | Levels.1 |
|---|---|
| Previous Daily High | 1.3378 |
| Previous Daily Low | 1.3329 |
| Previous Weekly High | 1.3255 |
| Previous Weekly Low | 1.3147 |
| Previous Monthly High | 1.3387 |
| Previous Monthly Low | 1.3093 |
| Daily Fibonacci 38.2% | 1.3359 |
| Daily Fibonacci 61.8% | 1.3348 |
| Daily Pivot Point S1 | 1.3329 |
| Daily Pivot Point S2 | 1.3304 |
| Daily Pivot Point S3 | 1.3280 |
| Daily Pivot Point R1 | 1.3378 |
| Daily Pivot Point R2 | 1.3403 |
| Daily Pivot Point R3 | 1.3427 |
[/s2If]
Download Nehcap EAWe have two EAs that are operational on our LIVE accounts.
- EA-FIX: Check out the details here. Download EA-FIX . EA-FIX is a non-grid HFT scalper.
- EA-GROWTH: High quality low dd EA using trend grids. Download EA_GROWTHJoin Our Telegram Group


