Ahead of labor market reports, the USDCAD pair is experiencing slight fluctuations within a slightly broader range.
…
This is a premium post.
[s2If !current_user_can(access_s2member_level4)]Please register for FREE REGISTER to read full post below containing analysis. In case of any error or you think you are not able to read the full post below, please email us at support#nehcap.com [lwa][/s2If] [s2If current_user_can(access_s2member_level1)]
- USD/CAD is oscillating in a tad wider range ahead of labor market reports.
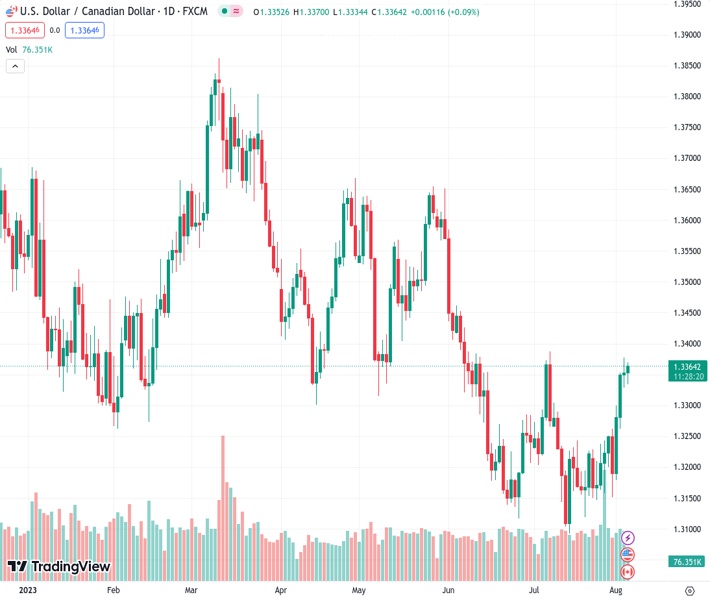
The pair currently trades last at 1.33648.
The previous day high was 1.3378 while the previous day low was 1.3329. The daily 38.2% Fib levels comes at 1.3359, expected to provide support. Similarly, the daily 61.8% fib level is at 1.3348, expected to provide support.
The USD/CAD pair rebounds after a modest corrective move to near 1.3330 in the London session. The Loonie asset is expected to remain sidelined as investors are awaiting the employment data of the United States and Canada.
US Unemployment Rate is seen steady at 3.6% while Canada’s jobless rate could increase to 5.5% vs. the former release of 5.4%. The US Dollar Index (DXY) manages to remain well supported above the immediate support of 102.40. Meanwhile, the market mood remains upbeat as investors shrug off volatility triggered by Fitch’s downgrade to the US government’s long-term debt rating.
On Thursday, US Services PMI and its forward demand underperformed expectations as the burden of high inflation squeezes deep pockets of households. The labor cost index is growing at a slower pace, reducing the spending capacity of individuals.
After a vertical north-side move, the USD/CAD pair reaches near the horizontal resistance plotted from July 07 high around 1.3387 on a four-hour scale. Upward-sloping 20-period Exponential Moving Average (EMA) at 1.3322 indicates that the bullish bias is extremely solid.
The Relative Strength Index (RSI) (14) climbs into the bullish range of 60.00-80.00, which indicates that the upside momentum is already active.
A decisive break above the July 07 high around 1.3387 would open a fresh upside, which will drive the asset towards the June 7 high at 1.3427, followed by the psychological resistance of 1.3500.
In an alternate scenario, a downside move below July 18 high at 1.3288 would drag the asset toward July 27 low around 1.3160 and July 14 low marginally below 1.3100.
Technical Levels: Supports and Resistances
USDCAD currently trading at 1.3364 at the time of writing. Pair opened at 1.3353 and is trading with a change of 0.08 % .
| Overview | Overview.1 | |
|---|---|---|
| 0 | Today last price | 1.3364 |
| 1 | Today Daily Change | 0.0011 |
| 2 | Today Daily Change % | 0.0800 |
| 3 | Today daily open | 1.3353 |
The pair is trading above its 20 Daily moving average @ 1.3221, above its 50 Daily moving average @ 1.3284 , below its 100 Daily moving average @ 1.3406 and below its 200 Daily moving average @ 1.3457
| Trends | Trends.1 | |
|---|---|---|
| 0 | Daily SMA20 | 1.3221 |
| 1 | Daily SMA50 | 1.3284 |
| 2 | Daily SMA100 | 1.3406 |
| 3 | Daily SMA200 | 1.3457 |
The previous day high was 1.3378 while the previous day low was 1.3329. The daily 38.2% Fib levels comes at 1.3359, expected to provide support. Similarly, the daily 61.8% fib level is at 1.3348, expected to provide support.
Note the levels of interest below:
- Pivot support is noted at 1.3329, 1.3304, 1.328
- Pivot resistance is noted at 1.3378, 1.3403, 1.3427
| Levels | Levels.1 |
|---|---|
| Previous Daily High | 1.3378 |
| Previous Daily Low | 1.3329 |
| Previous Weekly High | 1.3255 |
| Previous Weekly Low | 1.3147 |
| Previous Monthly High | 1.3387 |
| Previous Monthly Low | 1.3093 |
| Daily Fibonacci 38.2% | 1.3359 |
| Daily Fibonacci 61.8% | 1.3348 |
| Daily Pivot Point S1 | 1.3329 |
| Daily Pivot Point S2 | 1.3304 |
| Daily Pivot Point S3 | 1.3280 |
| Daily Pivot Point R1 | 1.3378 |
| Daily Pivot Point R2 | 1.3403 |
| Daily Pivot Point R3 | 1.3427 |
[/s2If]
Download Nehcap EAWe have two EAs that are operational on our LIVE accounts.
- EA-FIX: Check out the details here. Download EA-FIX . EA-FIX is a non-grid HFT scalper.
- EA-GROWTH: High quality low dd EA using trend grids. Download EA_GROWTHJoin Our Telegram Group


