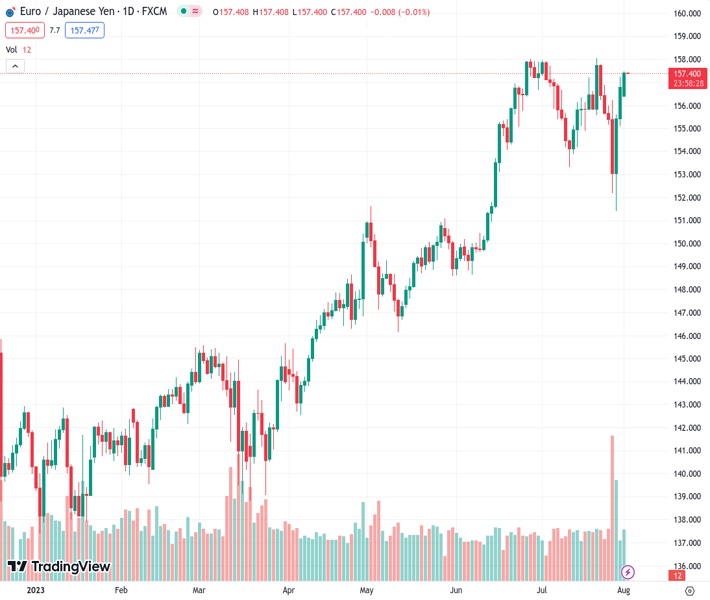
The EURJPY currency pair has been increasing for the past three days and is now trading above 157.00. It is currently maintaining its position above the 20-day Simple Moving Average (SMA).
…
This is a premium post.
[s2If !current_user_can(access_s2member_level4)]Please register for FREE REGISTER to read full post below containing analysis. In case of any error or you think you are not able to read the full post below, please email us at support#nehcap.com [lwa][/s2If] [s2If current_user_can(access_s2member_level1)]
- EUR/JPY is rising for a third consecutive day, above 157.00, consolidating itself above the 20-day SMA.
The pair currently trades last at 157.445.
The previous day high was 157.28 while the previous day low was 155.11. The daily 38.2% Fib levels comes at 156.45, expected to provide support. Similarly, the daily 61.8% fib level is at 155.94, expected to provide support.
The EUR/JPY continued to gain ground in Tuesday’s session. The EUR strengthened against most of its rivals. At the same time, the JPY continues to lose interest, mainly amid the Bank of Japan’s (BoJ) dovish stance and the weakness in China’s economic activity.
On the data front, the German, Spanish, Italian and French Manufacturing PMIs continued to show weakness in July, and the Eurozone’s index came in at 42.7, matching expectations and the previous reading. Other data showed that the Unemployment rate in Germany dropped in June to 5.6%, lower than the 5.7% expected, as well as in the Eurozone, where it dropped to 6.4% (vs 6.5% expected). Its worth noting that Christine Lagarde pointed out in the last European Central Bank (ECB) decision that the economic outlook remains highly uncertain but that the labour market remains robust. Regarding the following choices, she stated that they would depend on incoming that as she will retain an “open-minded” approach.
Regarding the Japanese Yen (JPY) is depreciating against other currencies as a result of the Bank of Japan’s (BoJ) dovish stance and limited flexibility in their Yield Control Curve (YCC). As long as inflation stays below their projections, the BoJ states it has no plans to normalise monetary policy.
In addition, Chinese economic data disappointed as the Caixin Manufacturing PMI fell to 49.2, indicating contraction and missing expectations of 50.3 and the previous 50.5. The weakness in China’s economy will likely impact the Japanese Yen (JPY) since China is Japan’s leading trading partner. The JPY may face downward pressure due to concerns over reduced trade and economic activity between the two countries.
Analysing the daily chart, the EUR/JPY technical outlook is bullish in the short term. The Relative Strength Index (RSI) is positioned above its midline in positive territory. It has a northward slope, indicating a favourable buying momentum. It is further supported by the positive signal from the Moving Average Convergence Divergence (MACD), which displays green bars, underscoring the growing bullish momentum. Moreover,the pair is above the 20,100 and 200-day Simple Moving Averages (SMAs), pointing towards the prevailing strength of the bulls in the larger context.
Resistance levels: 157.80,158.00, 159.00.
Support levels: 155.84 (20-day SMA), 155.500, 155.00.
Technical Levels: Supports and Resistances
EURJPY currently trading at 157.44 at the time of writing. Pair opened at 156.61 and is trading with a change of 0.53 % .
| Overview | Overview.1 | |
|---|---|---|
| 0 | Today last price | 157.44 |
| 1 | Today Daily Change | 0.83 |
| 2 | Today Daily Change % | 0.53 |
| 3 | Today daily open | 156.61 |
The pair remains strongly bullish on the daily timeframe. It trades above its 20 SMA @ 155.83, 50 SMA 153.99, 100 SMA @ 149.98 and 200 SMA @ 146.52.
| Trends | Trends.1 | |
|---|---|---|
| 0 | Daily SMA20 | 155.83 |
| 1 | Daily SMA50 | 153.99 |
| 2 | Daily SMA100 | 149.98 |
| 3 | Daily SMA200 | 146.52 |
The previous day high was 157.28 while the previous day low was 155.11. The daily 38.2% Fib levels comes at 156.45, expected to provide support. Similarly, the daily 61.8% fib level is at 155.94, expected to provide support.
Note the levels of interest below:
- Pivot support is noted at 155.38, 154.16, 153.21
- Pivot resistance is noted at 157.56, 158.51, 159.74
| Levels | Levels.1 |
|---|---|
| Previous Daily High | 157.28 |
| Previous Daily Low | 155.11 |
| Previous Weekly High | 157.80 |
| Previous Weekly Low | 151.41 |
| Previous Monthly High | 158.05 |
| Previous Monthly Low | 151.41 |
| Daily Fibonacci 38.2% | 156.45 |
| Daily Fibonacci 61.8% | 155.94 |
| Daily Pivot Point S1 | 155.38 |
| Daily Pivot Point S2 | 154.16 |
| Daily Pivot Point S3 | 153.21 |
| Daily Pivot Point R1 | 157.56 |
| Daily Pivot Point R2 | 158.51 |
| Daily Pivot Point R3 | 159.74 |
[/s2If]
Download Nehcap EAWe have two EAs that are operational on our LIVE accounts.
- EA-FIX: Check out the details here. Download EA-FIX . EA-FIX is a non-grid HFT scalper.
- EA-GROWTH: High quality low dd EA using trend grids. Download EA_GROWTHJoin Our Telegram Group


