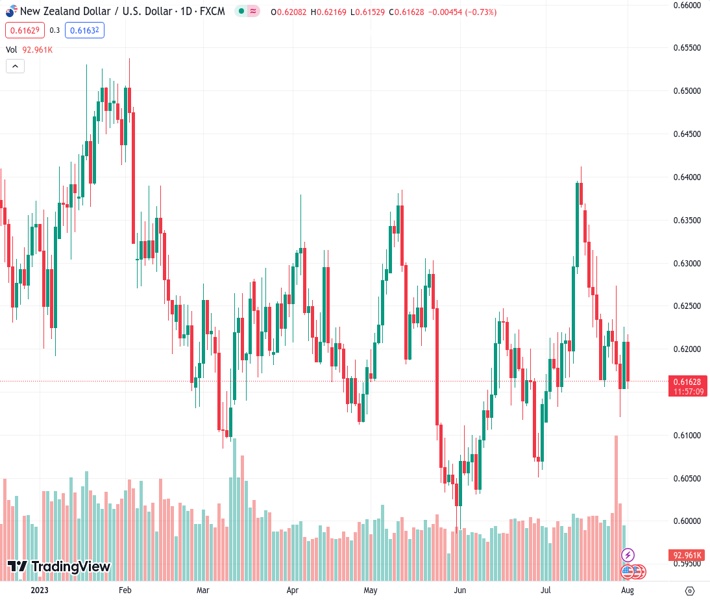
The NZDUSD pair, which is currently at 0.61607, encountered a new level of selling interest on Tuesday and is being influenced by multiple factors that are putting downward pressure on it.
…
This is a premium post.
[s2If !current_user_can(access_s2member_level4)]Please register for FREE REGISTER to read full post below containing analysis. In case of any error or you think you are not able to read the full post below, please email us at support#nehcap.com [lwa][/s2If] [s2If current_user_can(access_s2member_level1)]
- NZD/USD meets with a fresh supply on Tuesday and is pressured by a combination of factors.
The pair currently trades last at 0.61607.
The previous day high was 0.6226 while the previous day low was 0.6149. The daily 38.2% Fib levels comes at 0.6197, expected to provide resistance. Similarly, the daily 61.8% fib level is at 0.6178, expected to provide resistance.
The NZD/USD pair comes under some renewed selling pressure on Tuesday and reverses a major part of the previous day’s positive move. The intraday downfall remains uninterrupted through the early part of the European session and drags spot prices to a fresh daily low, around mid-0.6100s in the last hour.
The prospects for further policy tightening by the Federal Reserve (Fed) push the US Dollar (USD) to its highest level since July 10, which, in turn, is seen as a key factor exerting pressure on the NZD/USD pair. it is worth recalling that Fed Chair Jerome Powell said last week that the economy still needs to slow and the labour market to weaken for inflation to credibly return to the 2% target. Furthermore, the upbeat US GDP report pointed to an extremely resilient economy and kept the door for one more 25 bps rate hike in September or November wide open.
Apart from this, China’s economic woes contribute to driving flows away from antipodean currencies, including the New Zealand Dollar (NZD). Investors remain concerned that the post-COVID recovery in the world’s second-largest economy is losing steam and the fears were further fueled by the incoming weaker Chinese data. In fact, a private survey comes in line with the official PMI and showed that business activity in China’s manufacturing sector swung back into contraction territory, with Caixin/S&P Global Manufacturing PMI falling to 49.2 in July.
This, in turn, tempers investors’ appetite for riskier assets, which is evident from a generally softer tone around the US equity futures and exerts additional pressure on the risk-sensitive Kiwi. With the latest leg down, the NZD/USD pair has now moved well within the striking distance of a one-month trough, around the 0.6120 region touched last Thursday. The said area should now act as a pivotal point, which if broken decisively will be seen as a fresh trigger for bearish traders and pave the way for a further near-term depreciating move for the NZD/USD pair.
Market participants now look forward to the US economic docket, featuring the release of the ISM Manufacturing PMI and JOLTS Job Openings data. This, along with the broader risk sentiment, will influence the USD price dynamics and provide some impetus to the NZD/USD pair. The focus will then shift to the quarterly employment details from New Zealand, scheduled during the Asian session on Wednesday. Even a slight disappointment will be enough to weigh heavily on the domestic currency and set the stage for deeper losses.
Technical Levels: Supports and Resistances
NZDUSD currently trading at 0.6156 at the time of writing. Pair opened at 0.6209 and is trading with a change of -0.85 % .
| Overview | Overview.1 | |
|---|---|---|
| 0 | Today last price | 0.6156 |
| 1 | Today Daily Change | -0.0053 |
| 2 | Today Daily Change % | -0.8500 |
| 3 | Today daily open | 0.6209 |
The pair remains strongly bearish on the daily time frame. It trades below the 20 SMA @ 0.6232, 50 SMA 0.6166, 100 SMA @ 0.6198 and 200 SMA @ 0.6222.
| Trends | Trends.1 | |
|---|---|---|
| 0 | Daily SMA20 | 0.6232 |
| 1 | Daily SMA50 | 0.6166 |
| 2 | Daily SMA100 | 0.6198 |
| 3 | Daily SMA200 | 0.6222 |
The previous day high was 0.6226 while the previous day low was 0.6149. The daily 38.2% Fib levels comes at 0.6197, expected to provide resistance. Similarly, the daily 61.8% fib level is at 0.6178, expected to provide resistance.
Note the levels of interest below:
- Pivot support is noted at 0.6163, 0.6118, 0.6086
- Pivot resistance is noted at 0.624, 0.6272, 0.6317
| Levels | Levels.1 |
|---|---|
| Previous Daily High | 0.6226 |
| Previous Daily Low | 0.6149 |
| Previous Weekly High | 0.6274 |
| Previous Weekly Low | 0.6120 |
| Previous Monthly High | 0.6413 |
| Previous Monthly Low | 0.6120 |
| Daily Fibonacci 38.2% | 0.6197 |
| Daily Fibonacci 61.8% | 0.6178 |
| Daily Pivot Point S1 | 0.6163 |
| Daily Pivot Point S2 | 0.6118 |
| Daily Pivot Point S3 | 0.6086 |
| Daily Pivot Point R1 | 0.6240 |
| Daily Pivot Point R2 | 0.6272 |
| Daily Pivot Point R3 | 0.6317 |
[/s2If]
Download Nehcap EAWe have two EAs that are operational on our LIVE accounts.
- EA-FIX: Check out the details here. Download EA-FIX . EA-FIX is a non-grid HFT scalper.
- EA-GROWTH: High quality low dd EA using trend grids. Download EA_GROWTHJoin Our Telegram Group


