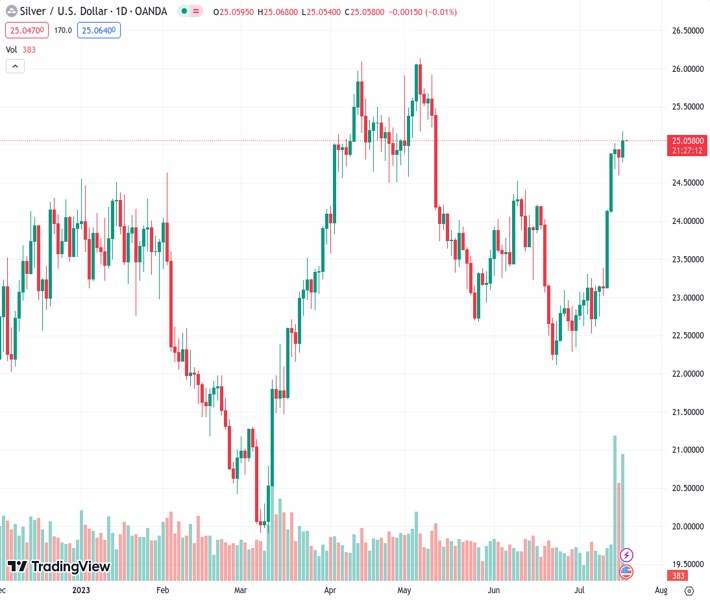
The US economy demonstrated weakness as retail sales, including core retail sales, in June came in below expectations, and there was a substantial decline in industrial production. #XAGUSD @ 25.052
…
This is a premium post.
[s2If !current_user_can(access_s2member_level4)]Please register for FREE REGISTER to read full post below containing analysis. In case of any error or you think you are not able to read the full post below, please email us at support#nehcap.com [lwa][/s2If] [s2If current_user_can(access_s2member_level1)]
- US retail sales in June and core retail sales fell short of estimates, while industrial production significantly declined, indicating weakness in the US economy.”
The pair currently trades last at 25.052.
The previous day high was 24.94 while the previous day low was 24.6. The daily 38.2% Fib levels comes at 24.73, expected to provide support. Similarly, the daily 61.8% fib level is at 24.81, expected to provide support.
Silver price advances as the Asian session begins, reclaiming the $25.00 figure, bolstered by soft economic data from the United States (US) and weaker inflation reports in Canada. That, alongside a ‘dovish’ tilt of European Central Bank (ECB) member Klas Knot, opened the door for the ECB to halt its tightening cycle. The XAG/USD exchanges hands at $25.06 troy ounce, gaining 0.01%.
In June, US Retail Sales saw a month-on-month increase of 0.2%, falling short of the estimated growth rate of 0.5%. When excluding automobile sales, the core retail sales figures also missed forecasts, with a modest 0.2% increase compared to the anticipated 0.3%. Other data released by the US Federal Reserve (Fed) revealed a significant decline in Industrial Production, flashing further weakness in the US economy. Monthly figures indicated a slide of -0.5% compared to the previous month, below the estimated 0% growth. Annually, market participants had projected a 1.1% expansion, but the data from June showed a decline of -0.4%.
In response to the data release, the XAG/USD jumped to its daily high of $25.17 before reversing its course, with Silver’s finishing the session with a close of $25.05. The US Dollar Index (DXY), which measures the dollar against a basket of other major currencies, currently stands at 99.817, representing a decrease of 0.07%.
Furthermore, US Treasury bond yields waved during the day, with the 2-year Treasury note yielding 4.764%, almost unchanged. The 10-year benchmark note is 3.789%, unchanged.
On the Canadian front, inflation data came softer than expected, while the ECB’s ‘dovish’ tilt by the ex-uber hawk Klas Knot suggested that “risks of perhaps doing too much, needs to be paid more attention to.”
Silver’s daily chart portrays the white metal as upward biased, but its gains could be capped around the May 11 high of $25.47, which could be tested soon. Even though the Relative Strength Index (RSI) is about to enter overbought conditions, XAG/USD might test the previously mentioned level, which, once breached, could send XAG/USD rallying toward $26.00. Otherwise, if Silver can’t surpass $25.00, XAG/USD’s immediate support would be the June 9 high at $24.52 before diving to $24.00.
Technical Levels: Supports and Resistances
XAGUSD currently trading at 25.06 at the time of writing. Pair opened at 24.85 and is trading with a change of 0.85 % .
| Overview | Overview.1 | |
|---|---|---|
| 0 | Today last price | 25.06 |
| 1 | Today Daily Change | 0.21 |
| 2 | Today Daily Change % | 0.85 |
| 3 | Today daily open | 24.85 |
The pair remains strongly bullish on the daily timeframe. It trades above its 20 SMA @ 23.2, 50 SMA 23.57, 100 SMA @ 23.56 and 200 SMA @ 22.79.
| Trends | Trends.1 | |
|---|---|---|
| 0 | Daily SMA20 | 23.20 |
| 1 | Daily SMA50 | 23.57 |
| 2 | Daily SMA100 | 23.56 |
| 3 | Daily SMA200 | 22.79 |
The previous day high was 24.94 while the previous day low was 24.6. The daily 38.2% Fib levels comes at 24.73, expected to provide support. Similarly, the daily 61.8% fib level is at 24.81, expected to provide support.
Note the levels of interest below:
- Pivot support is noted at 24.65, 24.46, 24.31
- Pivot resistance is noted at 24.99, 25.14, 25.34
| Levels | Levels.1 |
|---|---|
| Previous Daily High | 24.94 |
| Previous Daily Low | 24.60 |
| Previous Weekly High | 25.02 |
| Previous Weekly Low | 22.75 |
| Previous Monthly High | 24.53 |
| Previous Monthly Low | 22.11 |
| Daily Fibonacci 38.2% | 24.73 |
| Daily Fibonacci 61.8% | 24.81 |
| Daily Pivot Point S1 | 24.65 |
| Daily Pivot Point S2 | 24.46 |
| Daily Pivot Point S3 | 24.31 |
| Daily Pivot Point R1 | 24.99 |
| Daily Pivot Point R2 | 25.14 |
| Daily Pivot Point R3 | 25.34 |
[/s2If]
Download Nehcap EAWe have two EAs that are operational on our LIVE accounts.
- EA-FIX: Check out the details here. Download EA-FIX . EA-FIX is a non-grid HFT scalper.
- EA-GROWTH: High quality low dd EA using trend grids. Download EA_GROWTHJoin Our Telegram Group


