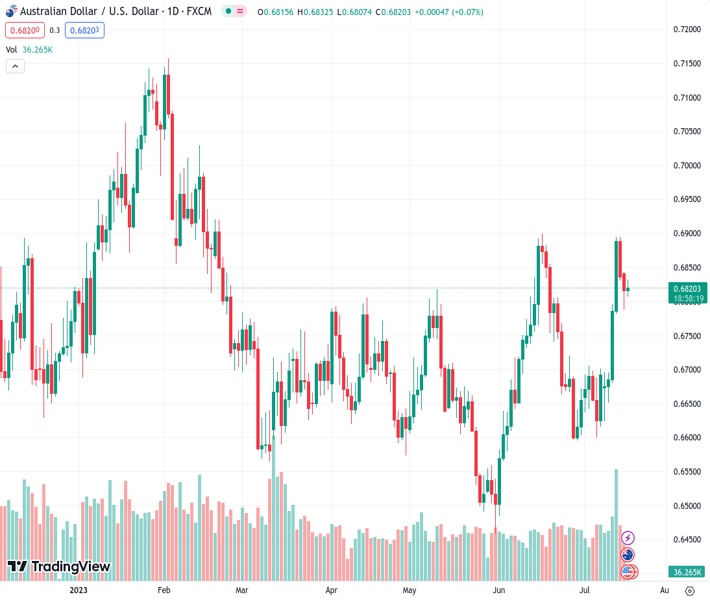
The AUDUSD currency pair at a rate of 0.68142 experienced a decline from its highest point of the day following the release of underwhelming Reserve Bank of Australia (RBA) Minutes.
…
This is a premium post.
[s2If !current_user_can(access_s2member_level4)]Please register for FREE REGISTER to read full post below containing analysis. In case of any error or you think you are not able to read the full post below, please email us at support#nehcap.com [lwa][/s2If] [s2If current_user_can(access_s2member_level1)]
- AUD/USD reverses from intraday high after unimpressive RBA Minutes.
The pair currently trades last at 0.68142.
The previous day high was 0.6854 while the previous day low was 0.6788. The daily 38.2% Fib levels comes at 0.6813, expected to provide support. Similarly, the daily 61.8% fib level is at 0.6829, expected to provide resistance.
AUD/USD reverses from the intraday high to around 0.6815 after the Reserve Bank of Australia’s (RBA) July Monetary Policy Meeting Minutes, published early Tuesday. In doing so, the Aussie pair fails to cheer the downbeat US Dollar, as well as the risk-positive headlines surrounding China.
As per the RBA’s July month Monetary Policy Meeting Minutes, “board agreed some further tightening may be required,” adding that “they would reconsider at August meeting.”
Also read: RBA Minutes: Board agreed some further tightening may be required, would reconsider at August meeting
With this, the Aussie pair pauses on the way to the 0.6900 upside hurdle amid cautious optimism in the market, backed by the hopes of improving the US-China ties and receding hawkish Feds. That said, Monday’s downbeat US NY Empire State Manufacturing Index for July joined the previous week’s disappointing US inflation outcomes to weigh on the US Dollar and underpin cautious optimism in the market.
It should be noted that US Climate Envoy John Kerry is in China to mark another effort by the Washington to improve the Sino-US ties. That said, the US policymaker met China’s top diplomat Wang Yi during early Tuesday while saying, per Reuters, “Our hope is now that this could be the beginning of new cooperation to solve the differences between us.”
Elsewhere, the US Dollar Index (DXY) drops to 99.76 while reversing Friday’s corrective bounce off the lowest level since April 2022 as the US statistics fail to inspire Fed hawks even as July rate hike is already given.
Amid these plays, S&P500 Futures appear indecisive while struggling to trace Wall Street’s gains whereas the US Treasury bond yields remain depressed and weigh on the US Dollar.
Looking ahead, US Retail Sales for June, expected to rise to 0.5% versus 0.3% prior, will be crucial to watch for clear directions of the AUD/USD. Also important will be the US Industrial Production for June, expected -0.1% versus -0.2% prior, as well as the US-China headlines and the bond market moves as Japan returns from a long weekend.
AUD/USD bounces off the 5-DMA level immediate support, around 0.6820 by the press time, to restore a run-up targeting the 0.6900 hurdle comprising tops marked in June-July.
Technical Levels: Supports and Resistances
AUDUSD currently trading at 0.6833 at the time of writing. Pair opened at 0.6816 and is trading with a change of 0.25% % .
| Overview | Overview.1 | |
|---|---|---|
| 0 | Today last price | 0.6833 |
| 1 | Today Daily Change | 0.0017 |
| 2 | Today Daily Change % | 0.25% |
| 3 | Today daily open | 0.6816 |
The pair remains strongly bullish on the daily timeframe. It trades above its 20 SMA @ 0.6714, 50 SMA 0.6687, 100 SMA @ 0.6686 and 200 SMA @ 0.6708.
| Trends | Trends.1 | |
|---|---|---|
| 0 | Daily SMA20 | 0.6714 |
| 1 | Daily SMA50 | 0.6687 |
| 2 | Daily SMA100 | 0.6686 |
| 3 | Daily SMA200 | 0.6708 |
The previous day high was 0.6854 while the previous day low was 0.6788. The daily 38.2% Fib levels comes at 0.6813, expected to provide support. Similarly, the daily 61.8% fib level is at 0.6829, expected to provide resistance.
Note the levels of interest below:
- Pivot support is noted at 0.6785, 0.6753, 0.6718
- Pivot resistance is noted at 0.6851, 0.6885, 0.6917
| Levels | Levels.1 |
|---|---|
| Previous Daily High | 0.6854 |
| Previous Daily Low | 0.6788 |
| Previous Weekly High | 0.6895 |
| Previous Weekly Low | 0.6624 |
| Previous Monthly High | 0.6900 |
| Previous Monthly Low | 0.6484 |
| Daily Fibonacci 38.2% | 0.6813 |
| Daily Fibonacci 61.8% | 0.6829 |
| Daily Pivot Point S1 | 0.6785 |
| Daily Pivot Point S2 | 0.6753 |
| Daily Pivot Point S3 | 0.6718 |
| Daily Pivot Point R1 | 0.6851 |
| Daily Pivot Point R2 | 0.6885 |
| Daily Pivot Point R3 | 0.6917 |
[/s2If]
Download Nehcap EAWe have two EAs that are operational on our LIVE accounts.
- EA-FIX: Check out the details here. Download EA-FIX . EA-FIX is a non-grid HFT scalper.
- EA-GROWTH: High quality low dd EA using trend grids. Download EA_GROWTHJoin Our Telegram Group


