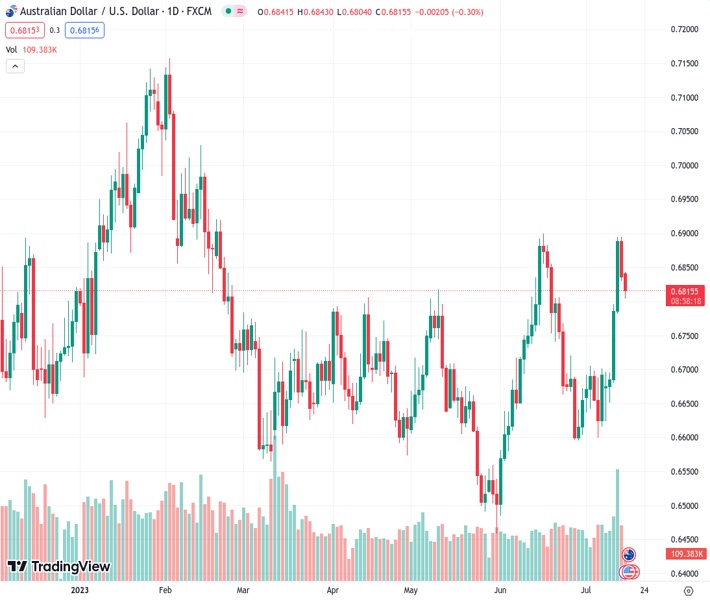
The AUDUSD currency pair, currently at 0.68147, is fluctuating above the 0.6800 level as attention turns to the release of RBA meeting notes and US Retail Sales data.
…
This is a premium post.
[s2If !current_user_can(access_s2member_level4)]Please register for FREE REGISTER to read full post below containing analysis. In case of any error or you think you are not able to read the full post below, please email us at support#nehcap.com [lwa][/s2If] [s2If current_user_can(access_s2member_level1)]
- AUD/USD is oscillating above 0.6800 as the focus shifts to RBA minutes and US Retail Sales data.
The pair currently trades last at 0.68147.
The previous day high was 0.6895 while the previous day low was 0.6831. The daily 38.2% Fib levels comes at 0.6855, expected to provide resistance. Similarly, the daily 61.8% fib level is at 0.687, expected to provide resistance.
The AUD/USD pair is demonstrating a back-and-forth action above the round-level support of 0.6800 in the European session. The Aussie asset has turned sideways as investors are awaiting Reserve Bank of Australia (RBA) minutes, which will be published on Tuesday at 01:30 GMT. Investors are anxious to know the reasoning behind keeping interest rates unchanged at 4.10%.
Meanwhile, S&P500 futures have generated some losses in London. Losses in US-500 stocks basket futures indicate caution among market participants as firms have started posting second-quarter results.
After the soft US Consumer Price Index (CPI) and stable labor market, investors are shifting their focus on the United States monthly Retail Sales data, which will also release on Tuesday. Investors are expecting an expansion of 0.5% vs. the prior release of 0.3%. The US Dollar Index (DXY) has frozen below the psychological resistance of 100.00.
AUD/USD has faced selling pressure while attempting to surpass the horizontal resistance plotted from June 15 high at around 0.6900 on a four-hour scale. The Aussie asset has corrected to near the 20-period Exponential Moving Average (EMA) at 0.6816. The short-term trend has turned neutral while the secular-term trend is still positive.
The Relative Strength Index (RSI) (14) has slipped into the 40.00-60.00 range, which indicates that the upside momentum has faded. However, the upside bias is still intact.
Going forward, a recovery move above the intraday high at 0.6854 would expose the asset to the round-level resistance of 0.6900, followed by January 09 high around 0.6950.
In an alternate scenario, a further breakdown below July 13 high at 0.6742 would drag the Aussie asset toward July 06 high around 0.6688. Slippage below the latter would further drag the asset toward July 10 low around 0.6623.
Technical Levels: Supports and Resistances
AUDUSD currently trading at 0.6815 at the time of writing. Pair opened at 0.6839 and is trading with a change of -0.35 % .
| Overview | Overview.1 | |
|---|---|---|
| 0 | Today last price | 0.6815 |
| 1 | Today Daily Change | -0.0024 |
| 2 | Today Daily Change % | -0.3500 |
| 3 | Today daily open | 0.6839 |
The pair remains strongly bullish on the daily timeframe. It trades above its 20 SMA @ 0.6716, 50 SMA 0.6686, 100 SMA @ 0.6685 and 200 SMA @ 0.6705.
| Trends | Trends.1 | |
|---|---|---|
| 0 | Daily SMA20 | 0.6716 |
| 1 | Daily SMA50 | 0.6686 |
| 2 | Daily SMA100 | 0.6685 |
| 3 | Daily SMA200 | 0.6705 |
The previous day high was 0.6895 while the previous day low was 0.6831. The daily 38.2% Fib levels comes at 0.6855, expected to provide resistance. Similarly, the daily 61.8% fib level is at 0.687, expected to provide resistance.
Note the levels of interest below:
- Pivot support is noted at 0.6815, 0.679, 0.675
- Pivot resistance is noted at 0.6879, 0.6919, 0.6943
| Levels | Levels.1 |
|---|---|
| Previous Daily High | 0.6895 |
| Previous Daily Low | 0.6831 |
| Previous Weekly High | 0.6895 |
| Previous Weekly Low | 0.6624 |
| Previous Monthly High | 0.6900 |
| Previous Monthly Low | 0.6484 |
| Daily Fibonacci 38.2% | 0.6855 |
| Daily Fibonacci 61.8% | 0.6870 |
| Daily Pivot Point S1 | 0.6815 |
| Daily Pivot Point S2 | 0.6790 |
| Daily Pivot Point S3 | 0.6750 |
| Daily Pivot Point R1 | 0.6879 |
| Daily Pivot Point R2 | 0.6919 |
| Daily Pivot Point R3 | 0.6943 |
[/s2If]
Download Nehcap EAWe have two EAs that are operational on our LIVE accounts.
- EA-FIX: Check out the details here. Download EA-FIX . EA-FIX is a non-grid HFT scalper.
- EA-GROWTH: High quality low dd EA using trend grids. Download EA_GROWTHJoin Our Telegram Group


