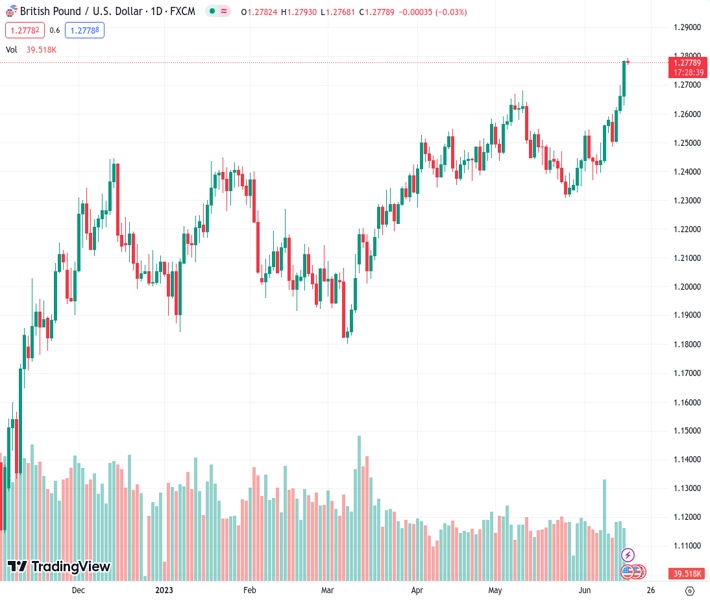
The GBPUSD pair, currently trading at 1.27785, is facing difficulty in determining its next move despite being at its highest levels since April 2022. The pair has broken its three-day uptrend.
…
This is a premium post.
[s2If !current_user_can(access_s2member_level4)]Please register for FREE REGISTER to read full post below containing analysis. In case of any error or you think you are not able to read the full post below, please email us at support#nehcap.com [lwa][/s2If] [s2If current_user_can(access_s2member_level1)]
- GBP/USD struggles for clear directions at the highest levels since April 2022, snaps three-day uptrend.
The pair currently trades last at 1.27785.
The previous day high was 1.2786 while the previous day low was 1.263. The daily 38.2% Fib levels comes at 1.2726, expected to provide support. Similarly, the daily 61.8% fib level is at 1.2689, expected to provide support.
GBP/USD steadies near the highest level in 14 months, making rounds to 1.2780-70 amid early Friday morning in London, as the Cable pair traders await more clues to defend the previous day’s heavy rally. That said, the Pound Sterling rose the most in a week while rising for the third consecutive day to refresh the multi-month high amid broad US Dollar weakness and hawkish concerns about the Bank of England (BoE).
Earlier in the week, a mixed batch of the UK details failed to tame the GBP/USD bulls amid hawkish BoE concerns, mainly due to the previously upbeat inflation numbers. the UK’s Gross Domestic Product (GDP) for April matches 0.2% growth versus -0.3% prior while the Industrial Production slumps during the stated month. That said, the Manufacturing Production also disappoints and so do the Index of Services for three months to April.
That said, US Dollar Index (DXY) picks up bids to pare the biggest daily loss in three months around 102.30, which in turn prods the Pound Sterling buyers. That said, the quote dropped heavily the previous day on mixed US data and the market’s lack of conviction about the Fed’s July rate hike, even if the policymakers did utter the same on Wednesday.
On Thursday, US Retail Sales growth marks an increase of 0.3% for May versus -0.1% expected and 0.4% previous readings while the Core readings, mean Retail Sales ex Autos, match 0.1% market forecasts for the said month, compared to 0.4% prior. Further, NY Fed Empire State Manufacturing Index jumps to 6.6 in June versus -15.1 expected and -31.8 prior whereas Philadelphia Fed Manufacturing Index drops to -13.7 for the said month from -10.4 prior and compared to -14 market forecasts. Additionally, US Industrial Production for May cools down to -0.2% against 0.1% estimated and 0.5% prior while Initial Jobless Claims reprints the upwardly revised figures of 262K for the week ended on June 09 versus 249K expected.
Against this backdrop, market players appear more hawkish on the BoE than the Fed and keep the Cable on the bull’s radar despite the latest pullback in the prices.
Looking ahead, UK’s Consumer Inflation Expectations for June will precede the preliminary readings of the Michigan Consumer Sentiment Index (CSI) and five-year inflation expectations for the said month to direct intraday GBP/USD moves.
Although the overbought RSI suggests a pullback in the GBP/USD price, the pair buyers remain optimistic unless witnessing a daily closing below the previous resistance line stretched from late January, around 1.2730-25 at the latest.
Technical Levels: Supports and Resistances
GBPUSD currently trading at 1.2775 at the time of writing. Pair opened at 1.2784 and is trading with a change of -0.07% % .
| Overview | Overview.1 | |
|---|---|---|
| 0 | Today last price | 1.2775 |
| 1 | Today Daily Change | -0.0009 |
| 2 | Today Daily Change % | -0.07% |
| 3 | Today daily open | 1.2784 |
The pair remains strongly bullish on the daily timeframe. It trades above its 20 SMA @ 1.2476, 50 SMA 1.2484, 100 SMA @ 1.2319 and 200 SMA @ 1.2039.
| Trends | Trends.1 | |
|---|---|---|
| 0 | Daily SMA20 | 1.2476 |
| 1 | Daily SMA50 | 1.2484 |
| 2 | Daily SMA100 | 1.2319 |
| 3 | Daily SMA200 | 1.2039 |
The previous day high was 1.2786 while the previous day low was 1.263. The daily 38.2% Fib levels comes at 1.2726, expected to provide support. Similarly, the daily 61.8% fib level is at 1.2689, expected to provide support.
Note the levels of interest below:
- Pivot support is noted at 1.268, 1.2577, 1.2524
- Pivot resistance is noted at 1.2836, 1.2889, 1.2993
| Levels | Levels.1 |
|---|---|
| Previous Daily High | 1.2786 |
| Previous Daily Low | 1.2630 |
| Previous Weekly High | 1.2590 |
| Previous Weekly Low | 1.2369 |
| Previous Monthly High | 1.2680 |
| Previous Monthly Low | 1.2308 |
| Daily Fibonacci 38.2% | 1.2726 |
| Daily Fibonacci 61.8% | 1.2689 |
| Daily Pivot Point S1 | 1.2680 |
| Daily Pivot Point S2 | 1.2577 |
| Daily Pivot Point S3 | 1.2524 |
| Daily Pivot Point R1 | 1.2836 |
| Daily Pivot Point R2 | 1.2889 |
| Daily Pivot Point R3 | 1.2993 |
[/s2If]
Nehcap Expert Advisor
The NEHCAP MT4 EA is high quality professional trading system geared to generate returns without using GRID or martingales. Each trade has strict risk per trade parameter. The pairs under management include EURUSD, GBPUSD, AUDCAD, AUDNZD,GBPAUD, EURAUD, EURCAD, CHFJPY and many more.
The system is trading live: LIVE ACCOUNT TRACKING
You can run it free. Apply for a free trial and track our account. Buy the system or use profit share mechanism to generate returns on your MT4.
Join Our Telegram Group


