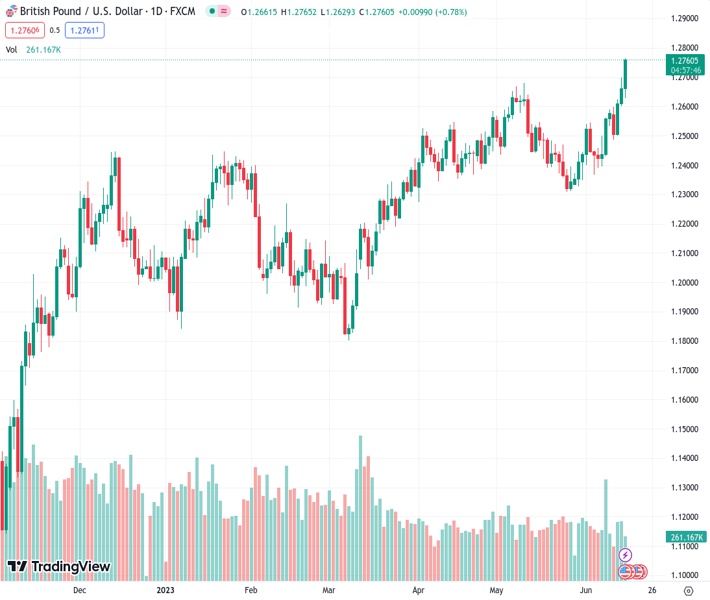
The GBP/USD currency pair, currently trading at 1.27597, is approaching the 1.2800 mark due to clues from the Bank of England indicating higher interest rate expectations and a weaker US dollar.
…
This is a premium post.
[s2If !current_user_can(access_s2member_level4)]Please register for FREE REGISTER to read full post below containing analysis. In case of any error or you think you are not able to read the full post below, please email us at support#nehcap.com [lwa][/s2If] [s2If current_user_can(access_s2member_level1)]
- GBP/USD nears 1.2800 amid BoE hawkish signals, soft US Dollar.
The pair currently trades last at 1.27597.
The previous day high was 1.2699 while the previous day low was 1.2601. The daily 38.2% Fib levels comes at 1.2662, expected to provide support. Similarly, the daily 61.8% fib level is at 1.2638, expected to provide support.
GBP/USD rallies sharply in the North American session, propelled by an interest rate hike by the European Central Bank (ECB) and a hold of the US Federal Reserve (Fed). Expectations that the Bank of England (BoE) could be the more hawkish central bank amongst G10 FX countries keep the GBP/USD underpinned toward the 1.2800 mark. At the time of writing, the GBP/USD is trading at 1.2764 after hitting a low of 1.2628.
Wall Street is trading with gains following the Fed’s decision to keep rates unchanged. Even though Jerome Powell and Co. telegraphed two more 25 bps rate hikes, the markets are not buying their narrative, as US Treasury bond yields drift lower, with the 10-year note yielding 3.753%, down four basis points (bps), while the greenback weakens across the board. In the meantime, the ECB lent a lifeline to the Pound Sterling (GBP) after lifting rates by 25 bps and suggesting more increases are coming.
Regarding economic data, US Retail Sales unexpectedly jumped in May by 0.3% MoM, against estimates for a 0.1% contraction, though it eased a tick compared to April’s data. Regarding the labor market, Initial Jobless Claims for the week ending June 10 rose 262K above the 249K analysts foresee, with back-to-back increases in claims, flashing that the labor market is cooling.
In other data, Industrial Production in the US, reported by the Fed, grew 0.2% YoY, though monthly figures showed a contraction of -0.2%. Aside from this, the Philadelphia Fed Manufacturing Index came better than expected but trailed May’s report; while the New York Empire State Manufacturing Index improved unexpectedly, exceeding estimates of -15.1, crushed last month’s reading of -31.8 at 6.6.
Across the pond, money market futures estimates the Bank of England (BoE) would continue to raise rates after solid employment data and April’s GDP figures. WIRP suggests a 25 bps hike in June is fully priced in, as well as August, September, and November, bringing the Bank Rate to 5.75%. Further data will be revealed the next week, with CPI for May expected at 8.5% YoY, compared to April’s 8.7%.
Once the GBP/USD conquered 1.2700, that exposed last year’s April 26 high at 1.2772 as the only resistance between the current exchange rate and the 1.28 handle. A breach of the latter will clear the path towards 1.3000, with resistance found at April 25 high at 1.2843 and April 13 low at 1.2972. Conversely, if GBP/USD drops below 1.2700, that would expose the May 10 high at 1.2679 before the major dips toward the 1.2600 figure. Downside risks lie at the 20-day Exponential Moving Average (EMA) at 1.2521, ahead of testing the June 12 low of 1.2487.
Technical Levels: Supports and Resistances
GBPUSD currently trading at 1.276 at the time of writing. Pair opened at 1.2666 and is trading with a change of 0.74 % .
| Overview | Overview.1 | |
|---|---|---|
| 0 | Today last price | 1.2760 |
| 1 | Today Daily Change | 0.0094 |
| 2 | Today Daily Change % | 0.7400 |
| 3 | Today daily open | 1.2666 |
The pair remains strongly bullish on the daily timeframe. It trades above its 20 SMA @ 1.2457, 50 SMA 1.2477, 100 SMA @ 1.2316 and 200 SMA @ 1.2032.
| Trends | Trends.1 | |
|---|---|---|
| 0 | Daily SMA20 | 1.2457 |
| 1 | Daily SMA50 | 1.2477 |
| 2 | Daily SMA100 | 1.2316 |
| 3 | Daily SMA200 | 1.2032 |
The previous day high was 1.2699 while the previous day low was 1.2601. The daily 38.2% Fib levels comes at 1.2662, expected to provide support. Similarly, the daily 61.8% fib level is at 1.2638, expected to provide support.
Note the levels of interest below:
- Pivot support is noted at 1.2612, 1.2558, 1.2514
- Pivot resistance is noted at 1.271, 1.2753, 1.2808
| Levels | Levels.1 |
|---|---|
| Previous Daily High | 1.2699 |
| Previous Daily Low | 1.2601 |
| Previous Weekly High | 1.2590 |
| Previous Weekly Low | 1.2369 |
| Previous Monthly High | 1.2680 |
| Previous Monthly Low | 1.2308 |
| Daily Fibonacci 38.2% | 1.2662 |
| Daily Fibonacci 61.8% | 1.2638 |
| Daily Pivot Point S1 | 1.2612 |
| Daily Pivot Point S2 | 1.2558 |
| Daily Pivot Point S3 | 1.2514 |
| Daily Pivot Point R1 | 1.2710 |
| Daily Pivot Point R2 | 1.2753 |
| Daily Pivot Point R3 | 1.2808 |
[/s2If]
Nehcap Expert Advisor
The NEHCAP MT4 EA is high quality professional trading system geared to generate returns without using GRID or martingales. Each trade has strict risk per trade parameter. The pairs under management include EURUSD, GBPUSD, AUDCAD, AUDNZD,GBPAUD, EURAUD, EURCAD, CHFJPY and many more.
The system is trading live: LIVE ACCOUNT TRACKING
You can run it free. Apply for a free trial and track our account. Buy the system or use profit share mechanism to generate returns on your MT4.
Join Our Telegram Group


