The currency pair USDMXN is continuing to trade within a range close to a historic low reached on Monday.
…
This is a premium post.
[s2If !current_user_can(access_s2member_level4)]Please register for FREE REGISTER to read full post below containing analysis. In case of any error or you think you are not able to read the full post below, please email us at support#nehcap.com [lwa][/s2If] [s2If current_user_can(access_s2member_level1)]
- USD/MXN extends its consolidative price move near a multi-year low touched on Monday.
The pair currently trades last at 17.2888.
The previous day high was 17.3353 while the previous day low was 17.2415. The daily 38.2% Fib levels comes at 17.2994, expected to provide resistance. Similarly, the daily 61.8% fib level is at 17.2773, expected to provide support.
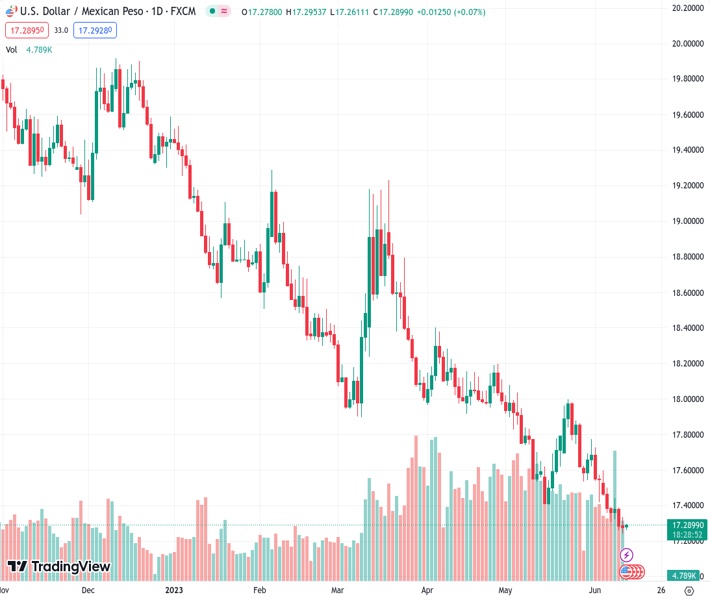
The USD/MXN pair continues with its struggle to register any meaningful recovery and oscillates in a range near its lowest level since May 2016 touched on Monday. The pair remains confined in a narrow band, around the 17.30-17.25 area, through the Asian session on Tuesday and the lack of any buying interest suggests that the downward trajectory witnessed over the past three weeks or so is still far from being over.
From a technical perspective, the USD/MXN pair has been drifting lower along a downward-sloping channel extending from the vicinity of the 18.00 mark touched on May 23. This points to a well-established short-term bearish trend and supports prospects for a further depreciating move. That said, the Relative Strength Index (RSI) on the daily chart has moved on the verge of breaking into the oversold territory and warrants some caution.
Hence, it will be prudent to wait for some near-term consolidation or a modest recovery before placing fresh bearish bets around the USD/MXN pair. Nevertheless, spot prices remain on track to challenge support marked by the lower end of the trend channel, currently around the 17.15 region, which is followed by the 17.00 round figure. A convincing break below the latter will mark a fresh breakdown and pave the way for further losses.
On the flip side, any meaningful recovery attempt is likely to confront stiff resistance ahead of the mid-17.00s, representing the top end of the aforementioned channel. A sustained strength beyond might trigger a short-covering rally and lift the USD/MXN pair towards the 17.70 intermediate resistance en route to the 18.00 round figure. The latter should act as a pivotal point, which if cleared decisively will suggest that spot prices have formed a near-term bottom.
Technical Levels: Supports and Resistances
USDMXN currently trading at 17.2924 at the time of writing. Pair opened at 17.2832 and is trading with a change of 0.05 % .
| Overview | Overview.1 | |
|---|---|---|
| 0 | Today last price | 17.2924 |
| 1 | Today Daily Change | 0.0092 |
| 2 | Today Daily Change % | 0.0500 |
| 3 | Today daily open | 17.2832 |
The pair remains strongly bearish on the daily time frame. It trades below the 20 SMA @ 17.5988, 50 SMA 17.8169, 100 SMA @ 18.1663 and 200 SMA @ 18.904.
| Trends | Trends.1 | |
|---|---|---|
| 0 | Daily SMA20 | 17.5988 |
| 1 | Daily SMA50 | 17.8169 |
| 2 | Daily SMA100 | 18.1663 |
| 3 | Daily SMA200 | 18.9040 |
The previous day high was 17.3353 while the previous day low was 17.2415. The daily 38.2% Fib levels comes at 17.2994, expected to provide resistance. Similarly, the daily 61.8% fib level is at 17.2773, expected to provide support.
Note the levels of interest below:
- Pivot support is noted at 17.2381, 17.1929, 17.1443
- Pivot resistance is noted at 17.3319, 17.3805, 17.4256
| Levels | Levels.1 |
|---|---|
| Previous Daily High | 17.3353 |
| Previous Daily Low | 17.2415 |
| Previous Weekly High | 17.5981 |
| Previous Weekly Low | 17.2591 |
| Previous Monthly High | 18.0780 |
| Previous Monthly Low | 17.4203 |
| Daily Fibonacci 38.2% | 17.2994 |
| Daily Fibonacci 61.8% | 17.2773 |
| Daily Pivot Point S1 | 17.2381 |
| Daily Pivot Point S2 | 17.1929 |
| Daily Pivot Point S3 | 17.1443 |
| Daily Pivot Point R1 | 17.3319 |
| Daily Pivot Point R2 | 17.3805 |
| Daily Pivot Point R3 | 17.4256 |
[/s2If]
Nehcap Expert Advisor
The NEHCAP MT4 EA is high quality professional trading system geared to generate returns without using GRID or martingales. Each trade has strict risk per trade parameter. The pairs under management include EURUSD, GBPUSD, AUDCAD, AUDNZD,GBPAUD, EURAUD, EURCAD, CHFJPY and many more.
The system is trading live: LIVE ACCOUNT TRACKING
You can run it free. Apply for a free trial and track our account. Buy the system or use profit share mechanism to generate returns on your MT4.
Join Our Telegram Group


