DXY seems to be facing some downside pressure below 104.00. (Pivot Orderbook analysis)
…
This is a premium post.
[s2If !current_user_can(access_s2member_level4)]Please register for FREE REGISTER to read full post below containing analysis. In case of any error or you think you are not able to read the full post below, please email us at support#nehcap.com [lwa][/s2If] [s2If current_user_can(access_s2member_level1)]
- DXY seems to be facing some downside pressure below 104.00.
- In case sellers push harder, the June low could become a target.
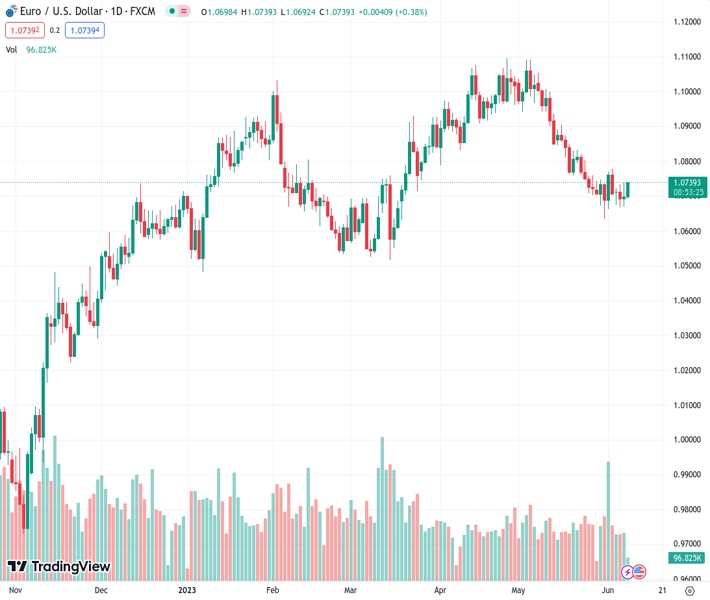
The pair currently trades last at 103.87.
The previous day high was 104.3 while the previous day low was 103.66. The daily 38.2% Fib levels comes at 103.9, expected to provide resistance. Similarly, the daily 61.8% fib level is at 104.05, expected to provide resistance.
DXY regains downside traction and breaches the 104.00 support to print daily lows near 103.80 on Thursday.
In case the index breaks below the weekly consolidation, a potential test of the June low of 103.38 (June 2) could emerge on the horizon prior to the transitory 100-day SMA at 102.98.
Looking at the broader picture, while below the 200-day SMA at 105.48 the outlook for the index is expected to remain negative.
Technical Levels: Supports and Resistances
EURUSD currently trading at 103.87 at the time of writing. Pair opened at 104.13 and is trading with a change of -0.25 % .
| Overview | Overview.1 | |
|---|---|---|
| 0 | Today last price | 103.87 |
| 1 | Today Daily Change | 26.00 |
| 2 | Today Daily Change % | -0.25 |
| 3 | Today daily open | 104.13 |
The pair is trading above its 20 Daily moving average @ 103.55, above its 50 Daily moving average @ 102.48 , above its 100 Daily moving average @ 102.98 and below its 200 Daily moving average @ 105.36
| Trends | Trends.1 | |
|---|---|---|
| 0 | Daily SMA20 | 103.55 |
| 1 | Daily SMA50 | 102.48 |
| 2 | Daily SMA100 | 102.98 |
| 3 | Daily SMA200 | 105.36 |
The previous day high was 104.3 while the previous day low was 103.66. The daily 38.2% Fib levels comes at 103.9, expected to provide resistance. Similarly, the daily 61.8% fib level is at 104.05, expected to provide resistance.
Note the levels of interest below:
- Pivot support is noted at 103.76, 103.39, 103.12
- Pivot resistance is noted at 104.4, 104.67, 105.04
| Levels | Levels.1 |
|---|---|
| Previous Daily High | 104.30 |
| Previous Daily Low | 103.66 |
| Previous Weekly High | 104.70 |
| Previous Weekly Low | 103.38 |
| Previous Monthly High | 104.70 |
| Previous Monthly Low | 101.03 |
| Daily Fibonacci 38.2% | 103.90 |
| Daily Fibonacci 61.8% | 104.05 |
| Daily Pivot Point S1 | 103.76 |
| Daily Pivot Point S2 | 103.39 |
| Daily Pivot Point S3 | 103.12 |
| Daily Pivot Point R1 | 104.40 |
| Daily Pivot Point R2 | 104.67 |
| Daily Pivot Point R3 | 105.04 |
[/s2If]
Nehcap Expert Advisor
The NEHCAP MT4 EA is high quality professional trading system geared to generate returns without using GRID or martingales. Each trade has strict risk per trade parameter. The pairs under management include EURUSD, GBPUSD, AUDCAD, AUDNZD,GBPAUD, EURAUD, EURCAD, CHFJPY and many more.
The system is trading live: LIVE ACCOUNT TRACKING
You can run it free. Apply for a free trial and track our account. Buy the system or use profit share mechanism to generate returns on your MT4.
Join Our Telegram Group


