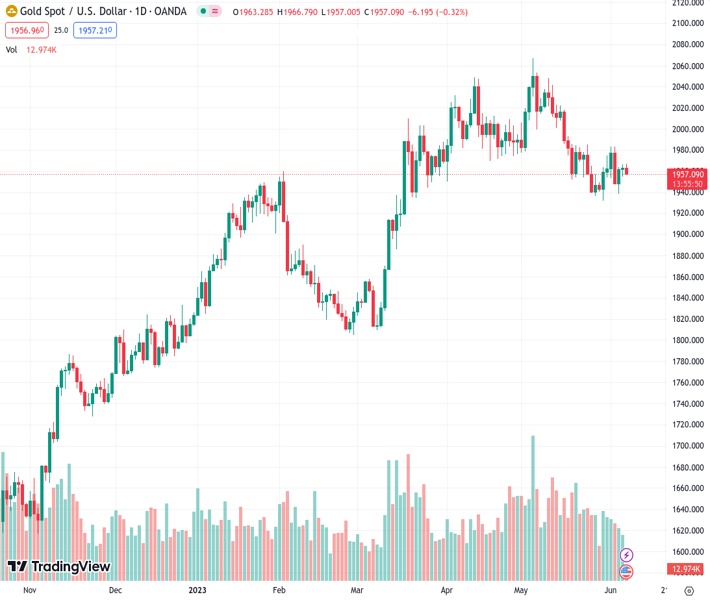
#XAUUSD @ 1,957.21 Gold price has attempted a downside break of the consolidation formed above $1,960.00 amid a recovery in the USD Index. (Pivot Orderbook analysis)
…
This is a premium post.
[s2If !current_user_can(access_s2member_level4)]Please register for FREE REGISTER to read full post below containing analysis. In case of any error or you think you are not able to read the full post below, please email us at support#nehcap.com [lwa][/s2If] [s2If current_user_can(access_s2member_level1)]
- Gold price has attempted a downside break of the consolidation formed above $1,960.00 amid a recovery in the USD Index.
- The expectations of a temporary pause in the policy-tightening spell by the Fed have soared due to weak US Services PMI.
- Gold price is consolidating in a range of $1,932-1,985 for the past three weeks.
The pair currently trades last at 1957.21.
The previous day high was 1966.43 while the previous day low was 1954.43. The daily 38.2% Fib levels comes at 1961.85, expected to provide resistance. Similarly, the daily 61.8% fib level is at 1959.01, expected to provide resistance.
Gold price (XAU/USD) has displayed a sharp drop to near $1,960.00 in the European session. The precious metal is trying to come out of the woods. A minor sell-off in the Gold price has been propelled by a recovery extension in the US Dollar Index (DXY).
S&P500 futures have carry-forwarded nominal gains added in Asia to the London session. The market mood is quite cheerful as investors are anticipating that the Federal Reserve (Fed) is going to consider a neutral interest rate policy stance thoroughly for June’s monetary policy.
The expectations of a temporary pause in the policy-tightening spell by the Fed have soared after the United States Services PMI, reported by the ISM agency, hardly managed to dodge contraction. The economic data was marginally above the 50.0 threshold. Subdued service sector and contracting factory activities are pushing the United States economy aggressively toward a recession.
The US Dollar Index has rebounded to near 104.25 despite the street is anticipating that divergence in Fed’s interest rate policy with other global central banks will drop as the former is likely to keep rates steady while others are preparing for a fresh interest rate hike. The yields offered on 10-year US government bonds have also rebounded marginally above 3.66%.
Gold price is consolidating in a range of $1,932-1,985 for the past three weeks on a four-hour. The precious metal is struggling in delivering a decisive move amid an absence of a potential trigger. Broadly, horizontal support is plotted from March 15 high at $1,937.39. The magical 200-period Exponential Moving Average (EMA) at $1,975.47 is acting as a strong barrier for the Gold bulls.
An oscillation in the 40.00-60.00 territory by the Relative Strength Index (RSI) (14) indicates a non-directional performance.
Technical Levels: Supports and Resistances
XAUUSD currently trading at 1958.95 at the time of writing. Pair opened at 1963.6 and is trading with a change of -0.24 % .
| Overview | Overview.1 | |
|---|---|---|
| 0 | Today last price | 1958.95 |
| 1 | Today Daily Change | -4.65 |
| 2 | Today Daily Change % | -0.24 |
| 3 | Today daily open | 1963.60 |
The pair is trading below its 20 Daily moving average @ 1974.4, below its 50 Daily moving average @ 1991.22 , above its 100 Daily moving average @ 1940.0 and above its 200 Daily moving average @ 1837.93
| Trends | Trends.1 | |
|---|---|---|
| 0 | Daily SMA20 | 1974.40 |
| 1 | Daily SMA50 | 1991.22 |
| 2 | Daily SMA100 | 1940.00 |
| 3 | Daily SMA200 | 1837.93 |
The previous day high was 1966.43 while the previous day low was 1954.43. The daily 38.2% Fib levels comes at 1961.85, expected to provide resistance. Similarly, the daily 61.8% fib level is at 1959.01, expected to provide resistance.
Note the levels of interest below:
- Pivot support is noted at 1956.54, 1949.49, 1944.54
- Pivot resistance is noted at 1968.54, 1973.49, 1980.54
| Levels | Levels.1 |
|---|---|
| Previous Daily High | 1966.43 |
| Previous Daily Low | 1954.43 |
| Previous Weekly High | 1983.50 |
| Previous Weekly Low | 1932.12 |
| Previous Monthly High | 2079.76 |
| Previous Monthly Low | 1932.12 |
| Daily Fibonacci 38.2% | 1961.85 |
| Daily Fibonacci 61.8% | 1959.01 |
| Daily Pivot Point S1 | 1956.54 |
| Daily Pivot Point S2 | 1949.49 |
| Daily Pivot Point S3 | 1944.54 |
| Daily Pivot Point R1 | 1968.54 |
| Daily Pivot Point R2 | 1973.49 |
| Daily Pivot Point R3 | 1980.54 |
[/s2If]
Nehcap Expert Advisor
The NEHCAP MT4 EA is high quality professional trading system geared to generate returns without using GRID or martingales. Each trade has strict risk per trade parameter. The pairs under management include EURUSD, GBPUSD, AUDCAD, AUDNZD,GBPAUD, EURAUD, EURCAD, CHFJPY and many more.
The system is trading live: LIVE ACCOUNT TRACKING
You can run it free. Apply for a free trial and track our account. Buy the system or use profit share mechanism to generate returns on your MT4.
Join Our Telegram Group


