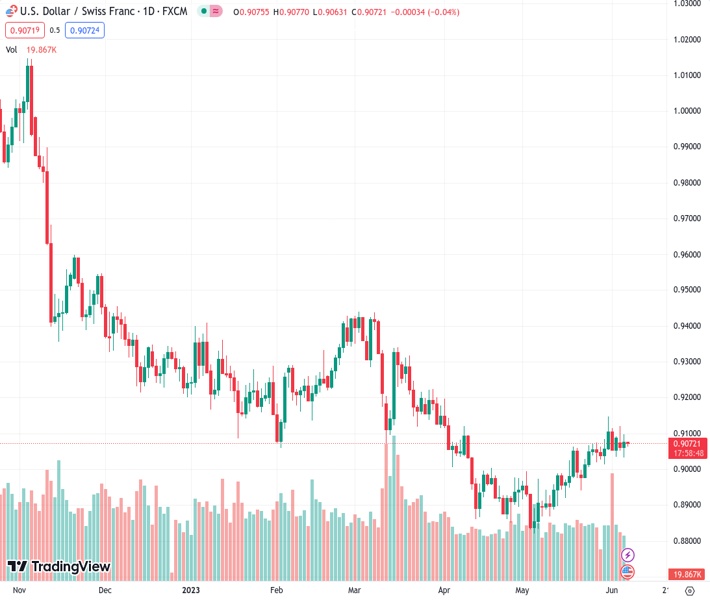
#USDCHF @ 0.90705 retreats towards intraday low, eyes first weekly loss in five., @nehcap view: Further downside expected (Pivot Orderbook analysis)
…
This is a premium post.
[s2If !current_user_can(access_s2member_level4)]Please register for FREE REGISTER to read full post below containing analysis. In case of any error or you think you are not able to read the full post below, please email us at support#nehcap.com [lwa][/s2If] [s2If current_user_can(access_s2member_level1)]
- USD/CHF retreats towards intraday low, eyes first weekly loss in five.
- Lower high prices join downbeat RSI (14) line, bearish MACD signals to keep sellers hopeful.
- One-month-old rising trend line, 100-SMA prod Swiss Franc (CHF) buyers.
The pair currently trades last at 0.90705.
The previous day high was 0.9098 while the previous day low was 0.9034. The daily 38.2% Fib levels comes at 0.9073, expected to provide resistance. Similarly, the daily 61.8% fib level is at 0.9058, expected to provide support.
USD/CHF clings to mild losses near 0.9070 as it fades bounce off the intraday low early Wednesday. In doing so, the Swiss Franc (CHF) pair struggles for clear directions while staying between the key support line stretched from March and a one-week-long descending resistance line. It should be noted that the quote fades bounce off the 100-SMA, poked the previous day.
Bearish MACD signals join the lower high formation on the RSI (14) line and the USD/CHF price to suggest the pair’s further downside.
However, a clear break of the aforementioned support line, near 0.9055 by the press time, becomes necessary for the USD/CHF bear’s entry. Even so, the 100-SMA support of 0.9037 can act as an additional check for the pair sellers.
Following that, a downward trajectory towards the 0.9000 psychological magnet and then to the 200-SMA level of around 0.8975 can be expected.
On the flip side, USD/CHF buyers need to cross a downward-sloping resistance line from the previous Wednesday, near 0.9105 as we write, to retake control.
In that case, the Swiss Franc (CHF) pair may challenge the previous monthly high of around 0.9150 before eyeing the yearly peak marked in March around 0.9440.
Trend: Further downside expected
Technical Levels: Supports and Resistances
USDCHF currently trading at 0.9072 at the time of writing. Pair opened at 0.9076 and is trading with a change of -0.04% % .
| Overview | Overview.1 | |
|---|---|---|
| 0 | Today last price | 0.9072 |
| 1 | Today Daily Change | -0.0004 |
| 2 | Today Daily Change % | -0.04% |
| 3 | Today daily open | 0.9076 |
The pair is trading above its 20 Daily moving average @ 0.9021, above its 50 Daily moving average @ 0.8996 , below its 100 Daily moving average @ 0.9124 and below its 200 Daily moving average @ 0.9369
| Trends | Trends.1 | |
|---|---|---|
| 0 | Daily SMA20 | 0.9021 |
| 1 | Daily SMA50 | 0.8996 |
| 2 | Daily SMA100 | 0.9124 |
| 3 | Daily SMA200 | 0.9369 |
The previous day high was 0.9098 while the previous day low was 0.9034. The daily 38.2% Fib levels comes at 0.9073, expected to provide resistance. Similarly, the daily 61.8% fib level is at 0.9058, expected to provide support.
Note the levels of interest below:
- Pivot support is noted at 0.904, 0.9005, 0.8976
- Pivot resistance is noted at 0.9105, 0.9134, 0.917
| Levels | Levels.1 |
|---|---|
| Previous Daily High | 0.9098 |
| Previous Daily Low | 0.9034 |
| Previous Weekly High | 0.9148 |
| Previous Weekly Low | 0.9014 |
| Previous Monthly High | 0.9148 |
| Previous Monthly Low | 0.8820 |
| Daily Fibonacci 38.2% | 0.9073 |
| Daily Fibonacci 61.8% | 0.9058 |
| Daily Pivot Point S1 | 0.9040 |
| Daily Pivot Point S2 | 0.9005 |
| Daily Pivot Point S3 | 0.8976 |
| Daily Pivot Point R1 | 0.9105 |
| Daily Pivot Point R2 | 0.9134 |
| Daily Pivot Point R3 | 0.9170 |
[/s2If]
Nehcap Expert Advisor
The NEHCAP MT4 EA is high quality professional trading system geared to generate returns without using GRID or martingales. Each trade has strict risk per trade parameter. The pairs under management include EURUSD, GBPUSD, AUDCAD, AUDNZD,GBPAUD, EURAUD, EURCAD, CHFJPY and many more.
The system is trading live: LIVE ACCOUNT TRACKING
You can run it free. Apply for a free trial and track our account. Buy the system or use profit share mechanism to generate returns on your MT4.
Join Our Telegram Group


